

What is Pitangus: self-hosted application security
Pitangus is a self-hosted application security tool. It analyzes your source code, its dependencies, your container images and, passively, your websites and APIs, keeps every finding in one registry, and tells you when a fix really landed. It is for small teams and the people who look after their security: you install it on your own machine or server, and your code never leaves it.
New to the vocabulary? A finding is a possible problem a tool reported (a vulnerable package, a leaked secret, a missing security header). The glossary defines every term used in these pages.
How it works
Section titled “How it works”Every scan of a repository, a container image or a verified domain follows the same path, from what you connect to the evidence you hand over.
- Engines in containers. Pitangus doesn’t write its own scanners. It runs established open-source engines, each pinned to a version and image digest, in a hardened container with no privileges: Opengrep, Betterleaks, Trivy, OSV-Scanner and zizmor for code and images by default, with Checkov and Grype as optional engines; httpx, testssl.sh and nuclei for the exposure check of a domain, and ZAP and katana for the full web scan, experimental.
- Runs. Every scan is a run: a record of what was analyzed, which steps ran, which didn’t and why. A step that didn’t run is reported as not tested, never as clean.
- Findings registry. Each finding gets a stable fingerprint, so the same problem is recognized across runs. What a later full scan no longer reports is marked fixed on its own; what comes back is reopened.
- Triage and verification. You decide what each finding is (in progress, false positive, accepted risk), and Verify again rescans to tell you whether a fix landed.
- Evidence. Reports (PDF, Markdown, SARIF, JSON), an SBOM and VEX statements, ready for an audit or a customer.
Key concepts explains each of these in more detail.
What Pitangus covers, and what it doesn’t
Section titled “What Pitangus covers, and what it doesn’t”Pitangus runs established open-source engines, pinned by digest, and adds what none of them has on its own: one registry with triage, deadlines, evidence, pull request review and proof that a fix is real. That’s also where it stops. Compared with a commercial suite (Snyk, Checkmarx, Veracode…), this is where it stands:
| Area | What runs | Where it falls short |
|---|---|---|
| Dependencies (SCA) | Trivy and OSV-Scanner over NVD, GHSA and OSV, with KEV and EPSS; known malicious packages (OpenSSF MAL-*, typed as malware, or with CWE, title and description agreeing) as findings of their own |
No reachability analysis: a vulnerable function is reported whether your code calls it or not. |
| Secrets | Betterleaks and Trivy, with your own detectors, allowlists and built-in rules turned off per repository. Credential files (.env*, .npmrc, SSH keys…) are read by them alone, in a copy deleted afterwards |
Only the files of the scanned commit: a secret deleted in an earlier commit but still in Git history isn’t seen. Whether a secret still works is checked only with PITANGUS_SECRET_VALIDATION (off by default: it sends the secret to its provider); otherwise every one is critical until rotated. |
| Container images | Trivy on the layers, history and configuration, read from the registry; Grype as a second opinion when turned on (PITANGUS_GRYPE_ENABLED) |
The image is never run, so nothing about its behavior at runtime is checked. |
| Infrastructure and pipelines | Trivy (Terraform, Kubernetes, Dockerfiles…) and zizmor (GitHub Actions); Checkov adds more checks and other CI systems when turned on (PITANGUS_CHECKOV_ENABLED) |
An engine that is off is shown as not run, never as clean. Checkov’s free edition gives no severity; Pitangus assigns one by rule. |
| Your own code (SAST) | Opengrep with the 66 Pitangus rules in rules/ (14 with taint tracking inside one file), including what AI-written code often gets wrong; a reader of Supabase migrations and Firebase rules; optionally 259 of GitLab’s rules (PITANGUS_THIRD_PARTY_RULES) |
This is the thinnest layer. No cross-file data flow, and no framework knowledge beyond those rules. For deep analysis, run CodeQL or Semgrep and bring their results in: they get the same lifecycle. |
| Websites and APIs (DAST) | The exposure check of a verified domain, always available: each host’s root and known paths with httpx, testssl.sh and nuclei, no crawl. The full scan is experimental: ZAP (spider, AJAX spider and passive rules, or the GET and HEAD operations of an OpenAPI definition), plus katana, nuclei (detection-only templates), testssl.sh and httpx. Optional saved headers and up to 3 test users per scan; on demand or on a schedule. Off unless the server sets PITANGUS_DAST_ENABLED=1; turning it off fixes nothing it found. See Scan a website or API. |
Passive only: no injections or other attacks, no form submissions other than a test user’s sign-in, no POST, PUT or DELETE. Crawls are capped in time, so a large site isn’t covered whole. Only ZAP signs in as test users; whether saved headers still sign in is checked only if the domain has a session check page. One web scan at a time per installation. For active tests, run your own scanner and import its results. |
| Scale | One scan per worker; as many workers as you need, on one machine or several | No parallel scans inside a worker, no autoscaling manifests, no published benchmark. See Scaling. |
What a commercial suite can’t offer is the other half of the table: it runs on your server, the code never leaves it, there’s no per-developer price, and the source is open (AGPL-3.0).
In development
Section titled “In development”These appear greyed out in the panel, marked In development. Today they produce no results and can’t be used:
| Feature | What it will do |
|---|---|
| Active web scans | Active tests only with an administrator’s authorization recorded in the run. Passive web and API scans already work. |
| GitLab, Bitbucket, Azure DevOps | Connect repositories with read-only project tokens. Today, scan them in their own pipelines with scan. |
| AI assistance | Finding explanations and patch proposals with your own key, with consent on every run. AI plays no part in any scan today. |
| Public API | Scoped personal tokens and a documented /api/v1. |
A short tour of the panel
Section titled “A short tour of the panel”The sidebar has three groups: Risk (Overview, Findings, Threats, Coverage, CVE tracker, Compliance), Scanning (Scans, Repositories, Images, Domains & APIs, Pull requests) and Settings (Policies, Integrations and, for administrators, Users). The header always has New scan.
Overview
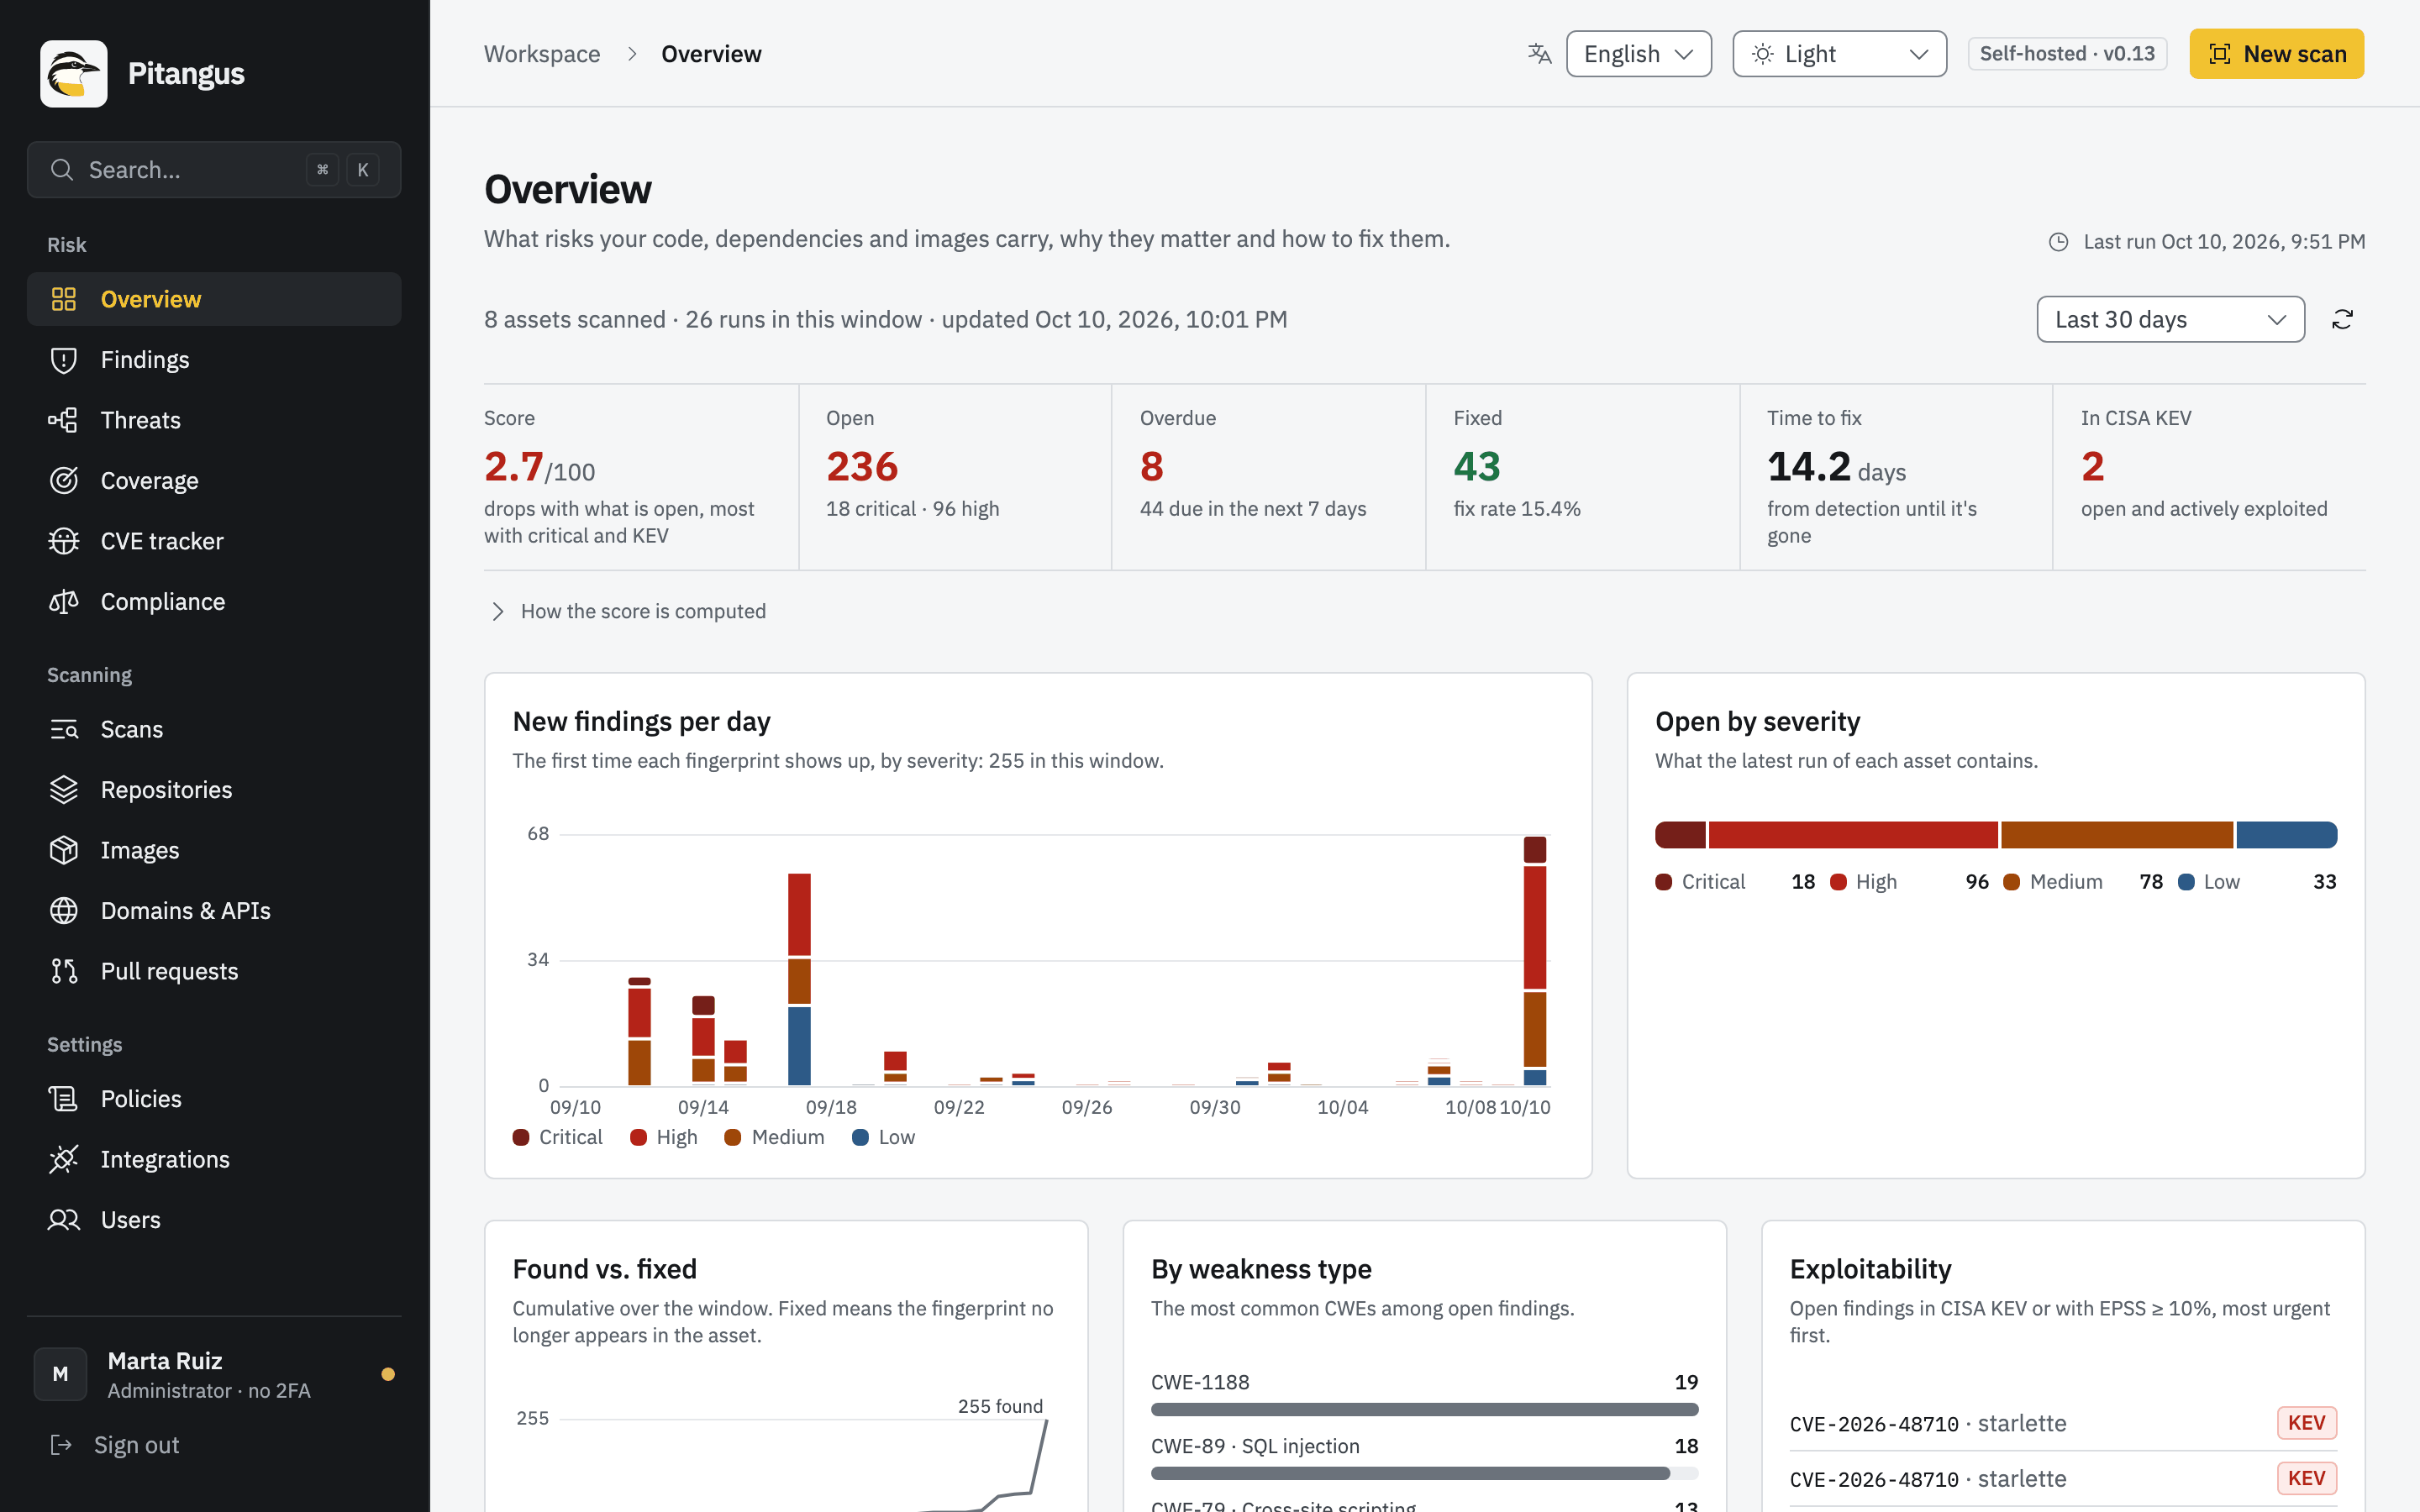
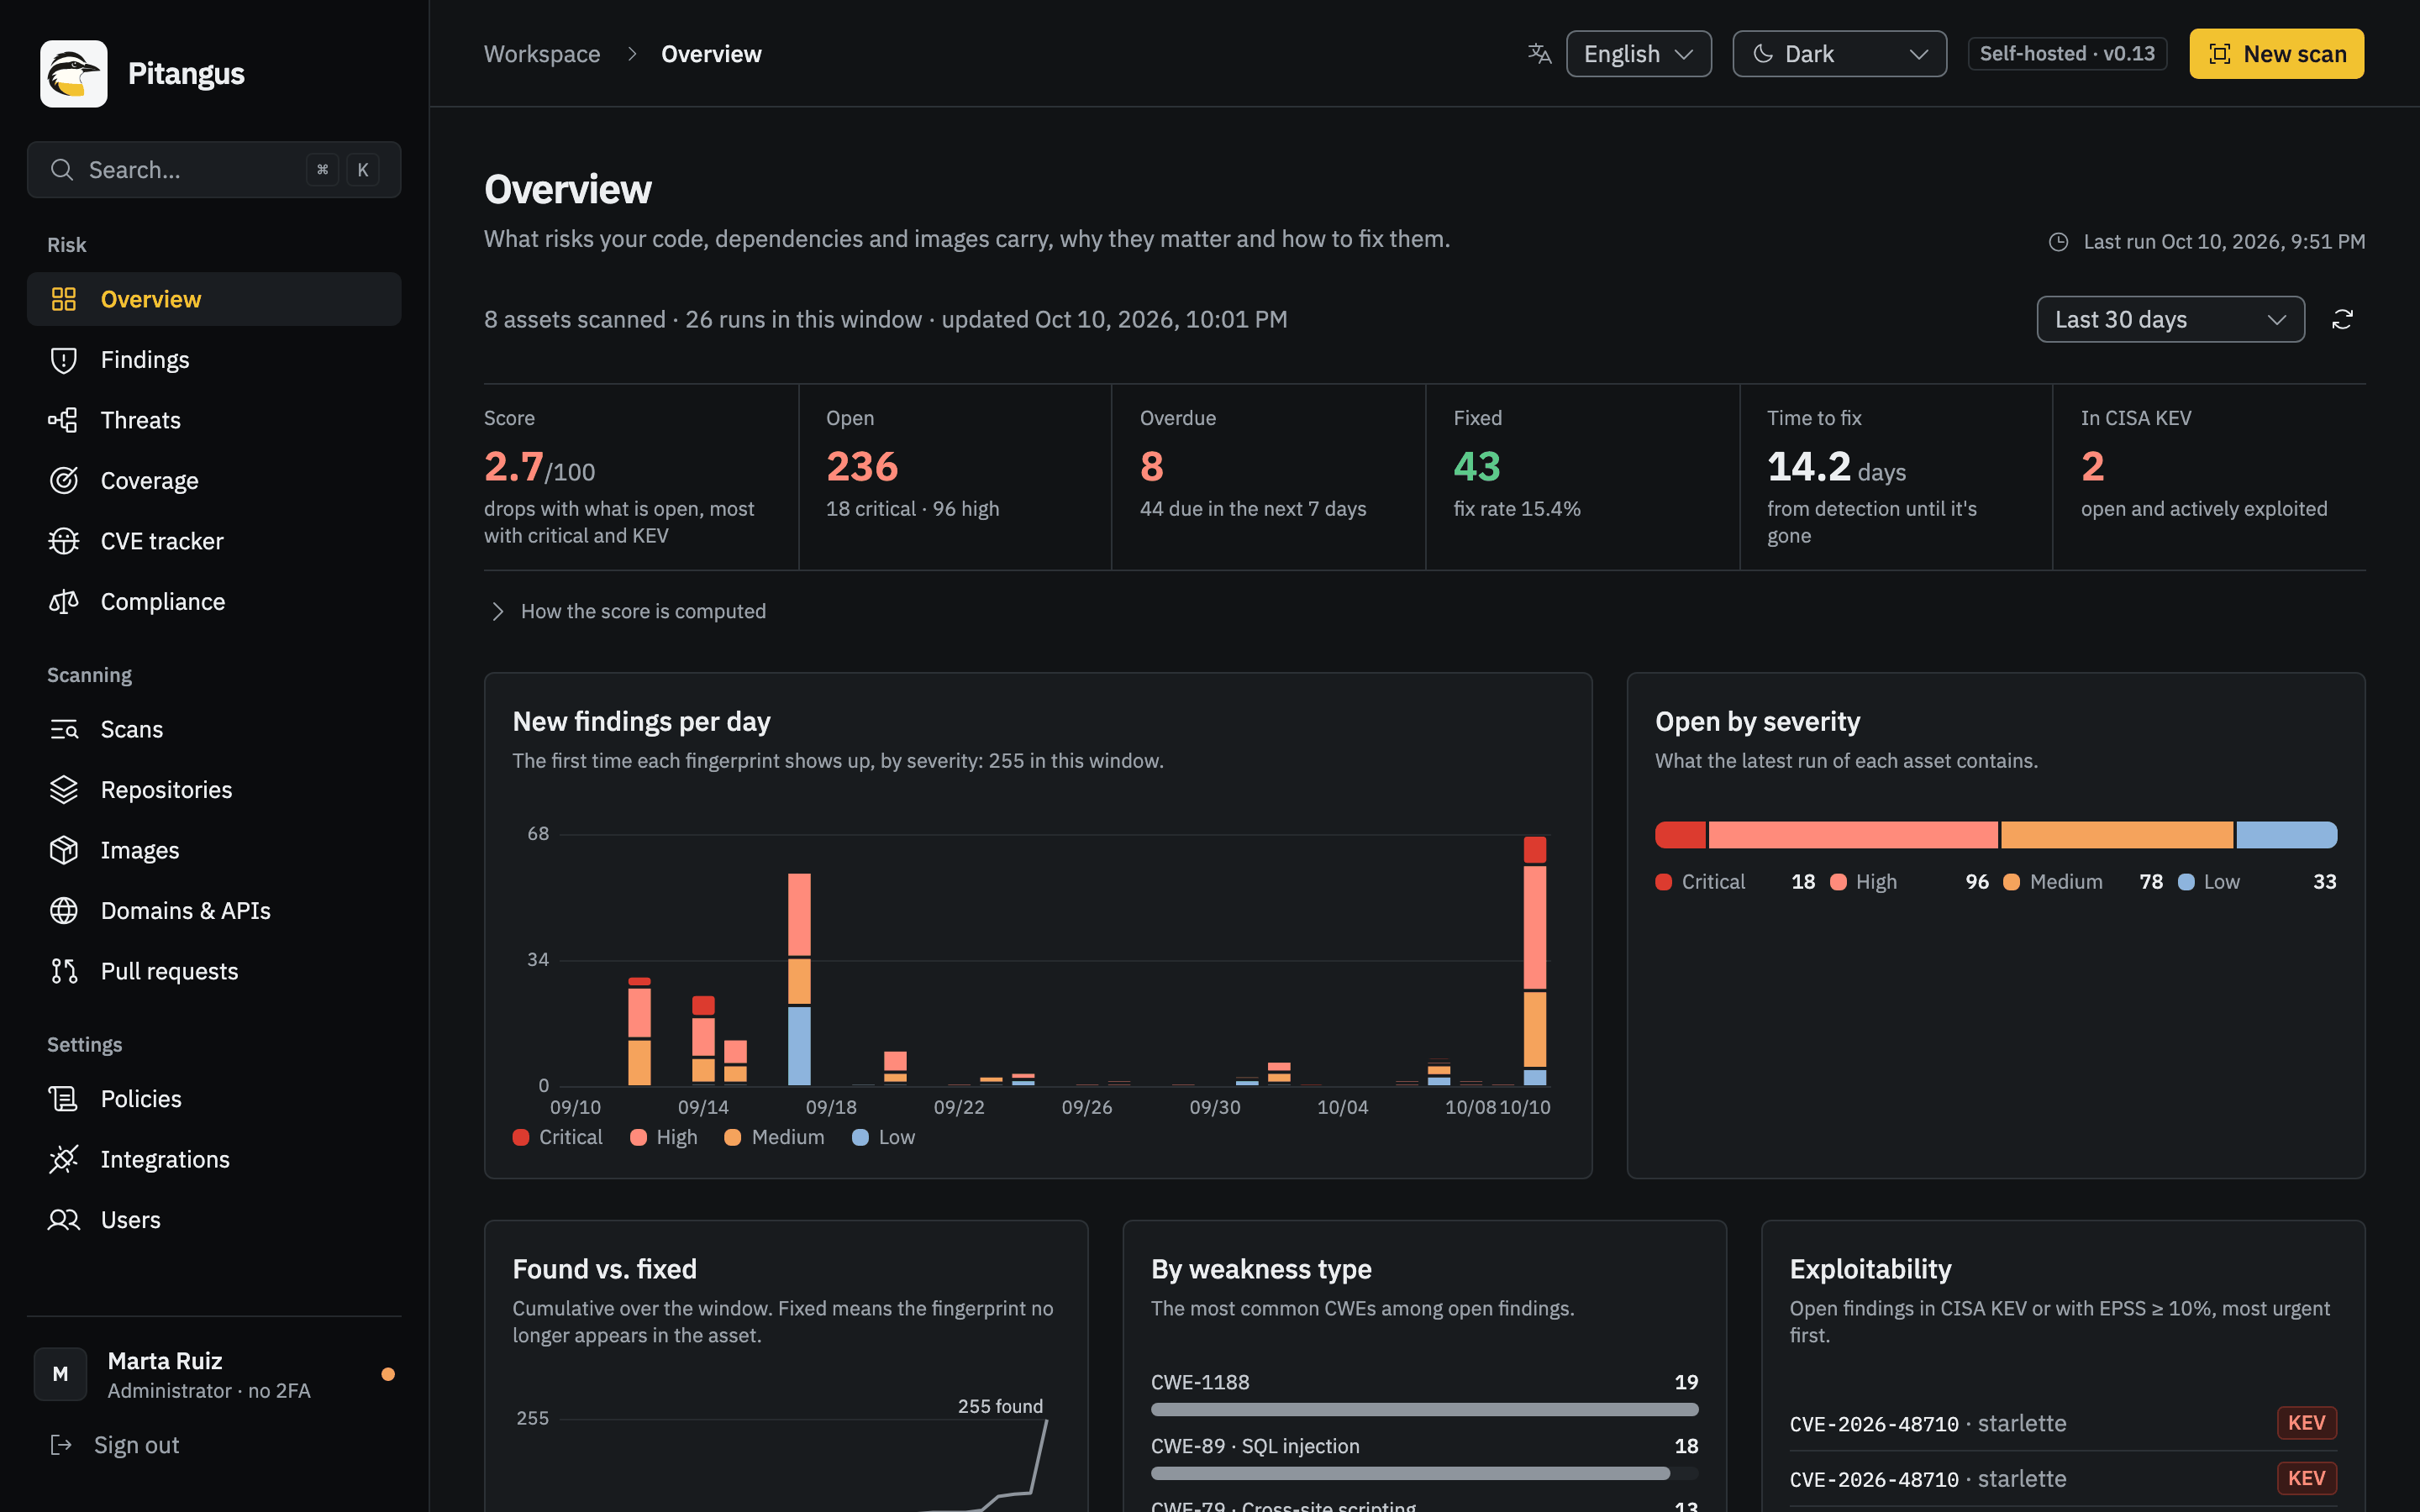
Section titled “Overview”Overview (#/overview) summarizes the risk of everything you’ve scanned: open findings by severity, actively
exploited vulnerabilities (KEV), what’s overdue, found versus fixed over time, and the latest CVEs. Every figure is
computed from runs with its definition in view. On a new installation it starts with Getting started, a checklist
that ticks itself off.
Findings
Section titled “Findings”Findings (#/findings) is the registry: the current state of every finding for one asset, an organization or
several at once, with filters, triage, deadlines, fix guides and exports. See Findings.
Scans (#/analyses) lists every run with its type, status and results. Open one to see its steps (completed,
partial, skipped, not tested) and its limitations.
Domains & APIs
Section titled “Domains & APIs”Domains & APIs (#/domains) holds the sites and APIs you control. An administrator adds a domain, proves control
of it once, and then can scan it passively. Each domain has tabs for Overview, Findings, Scans, Scope
and Test users. See Scan a website or API.
Integrations
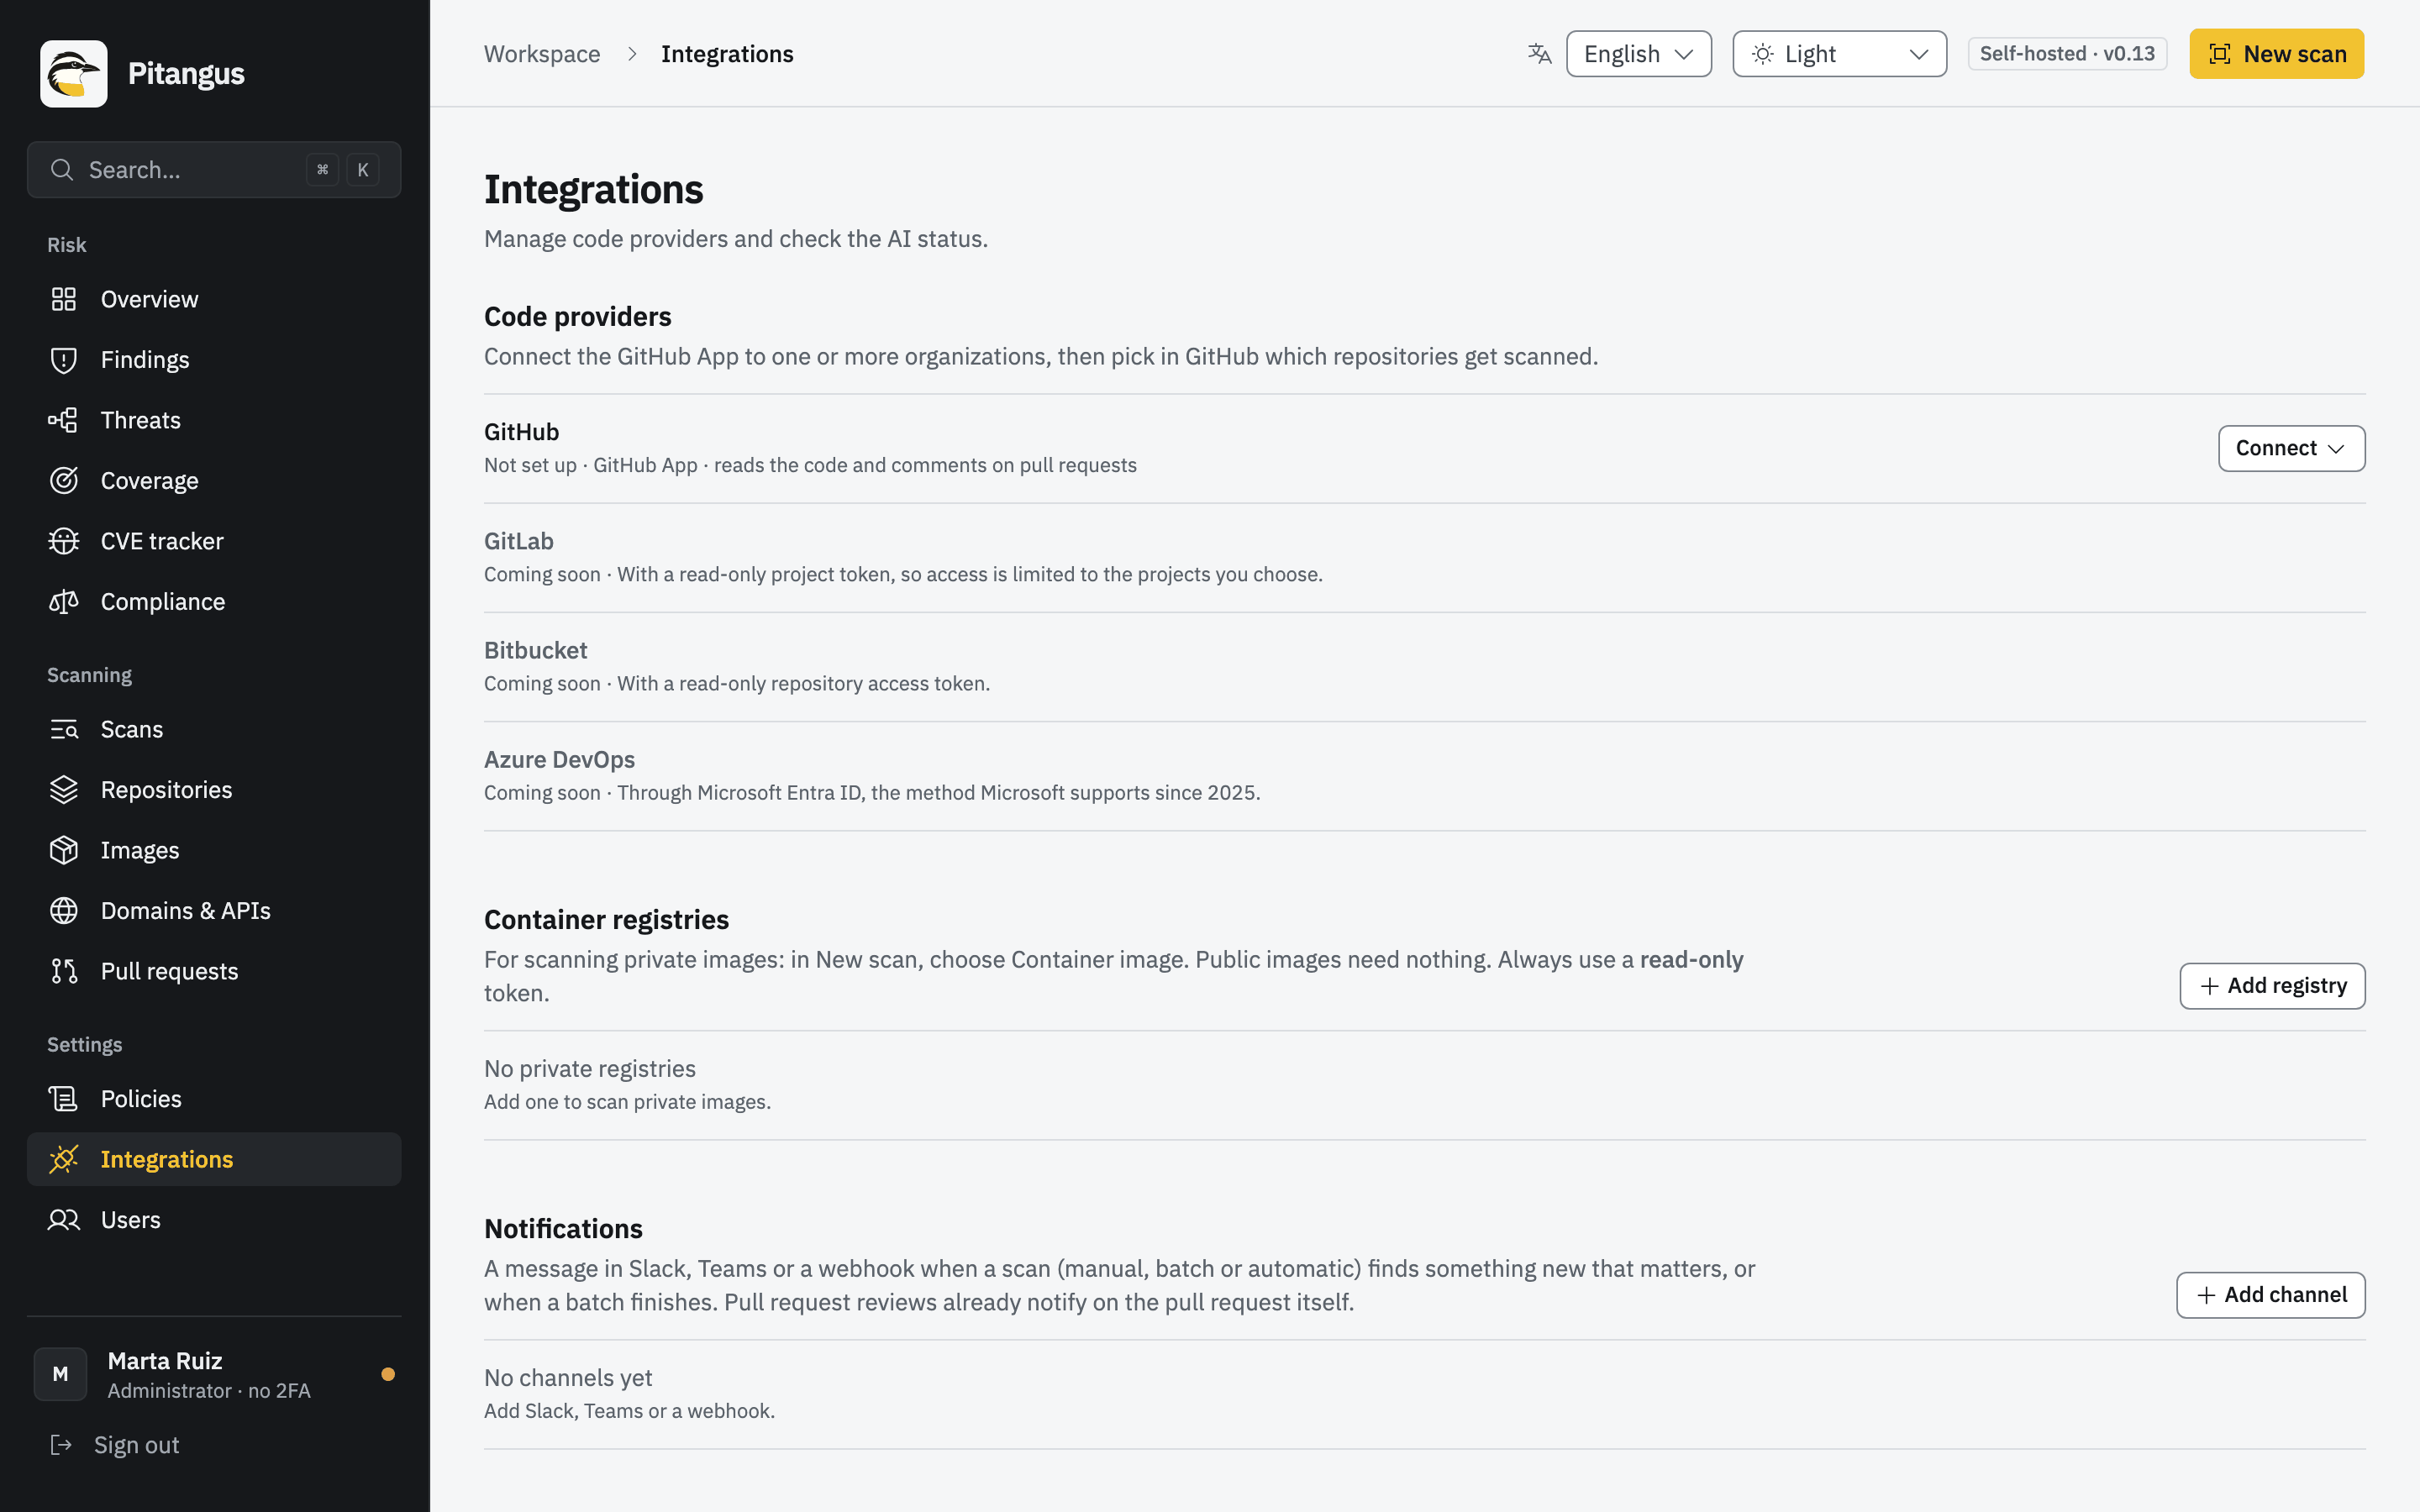
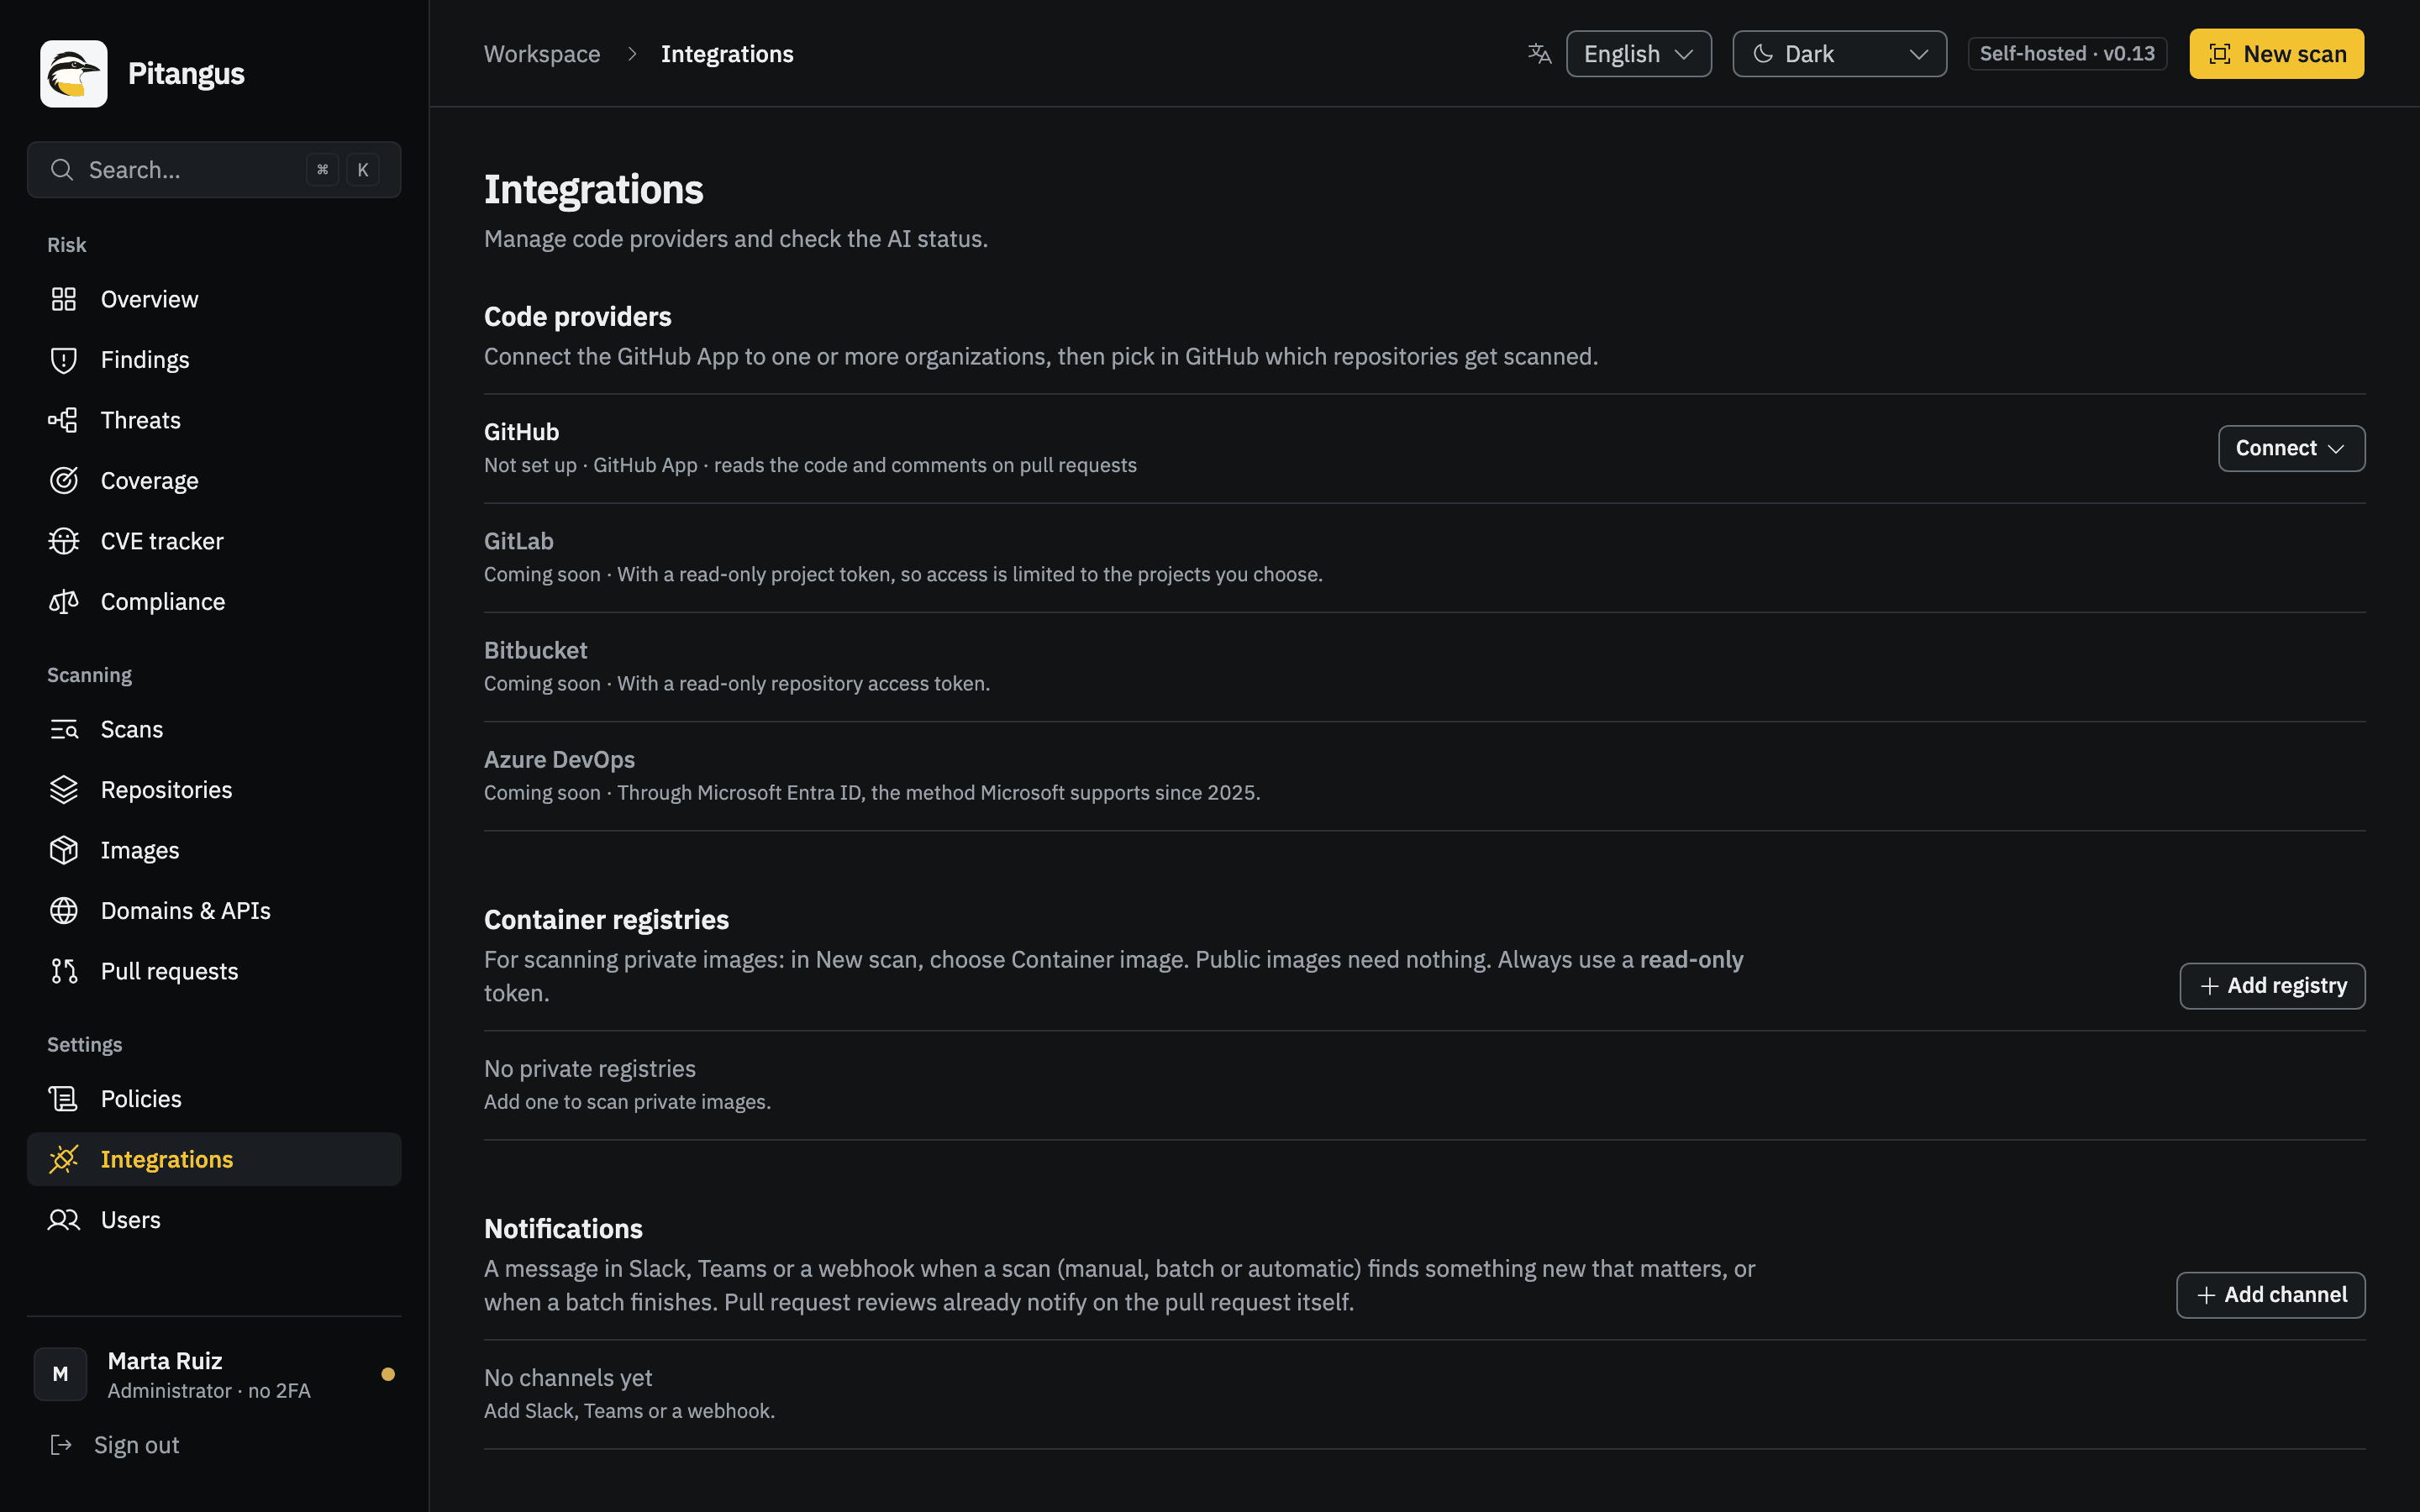
Section titled “Integrations”Integrations (#/integrations) is a page of sections: Code providers (the GitHub App), Container
registries, Notifications (Slack, Teams, webhooks; administrators only), Issue tracking (Jira Cloud) and AI
assistance (coming soon). See Integrations and automation.
Command palette and keyboard shortcuts
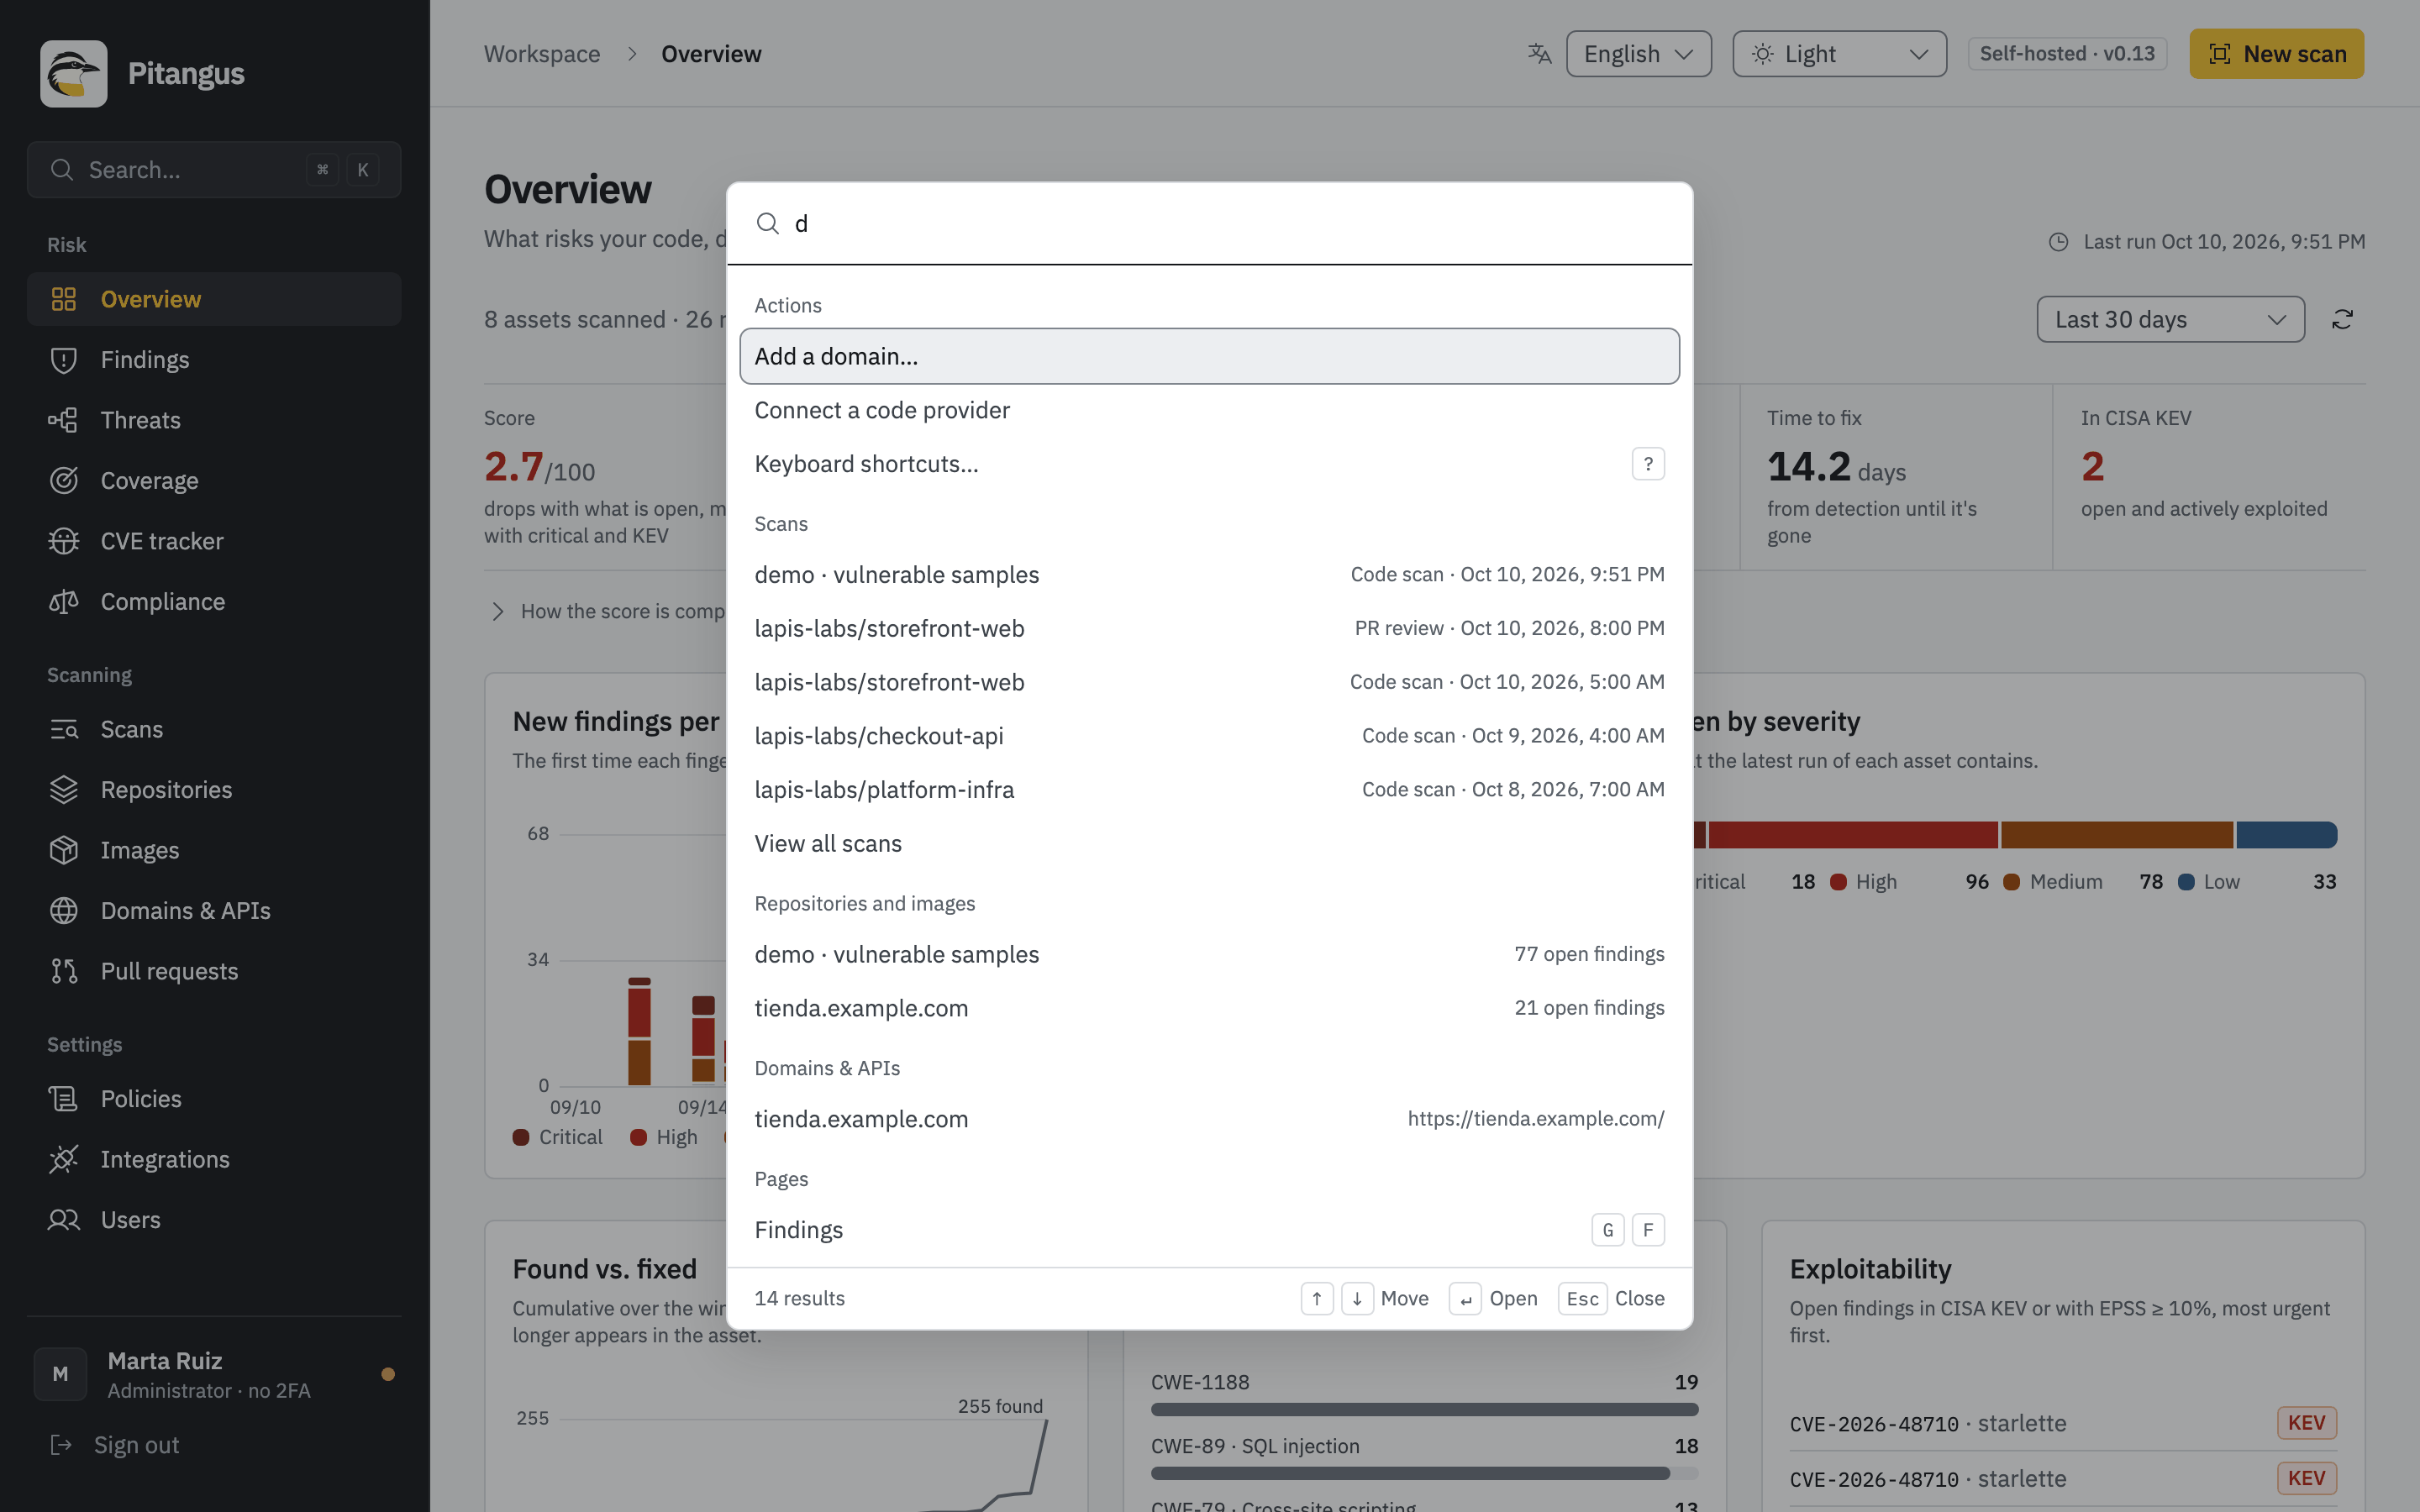
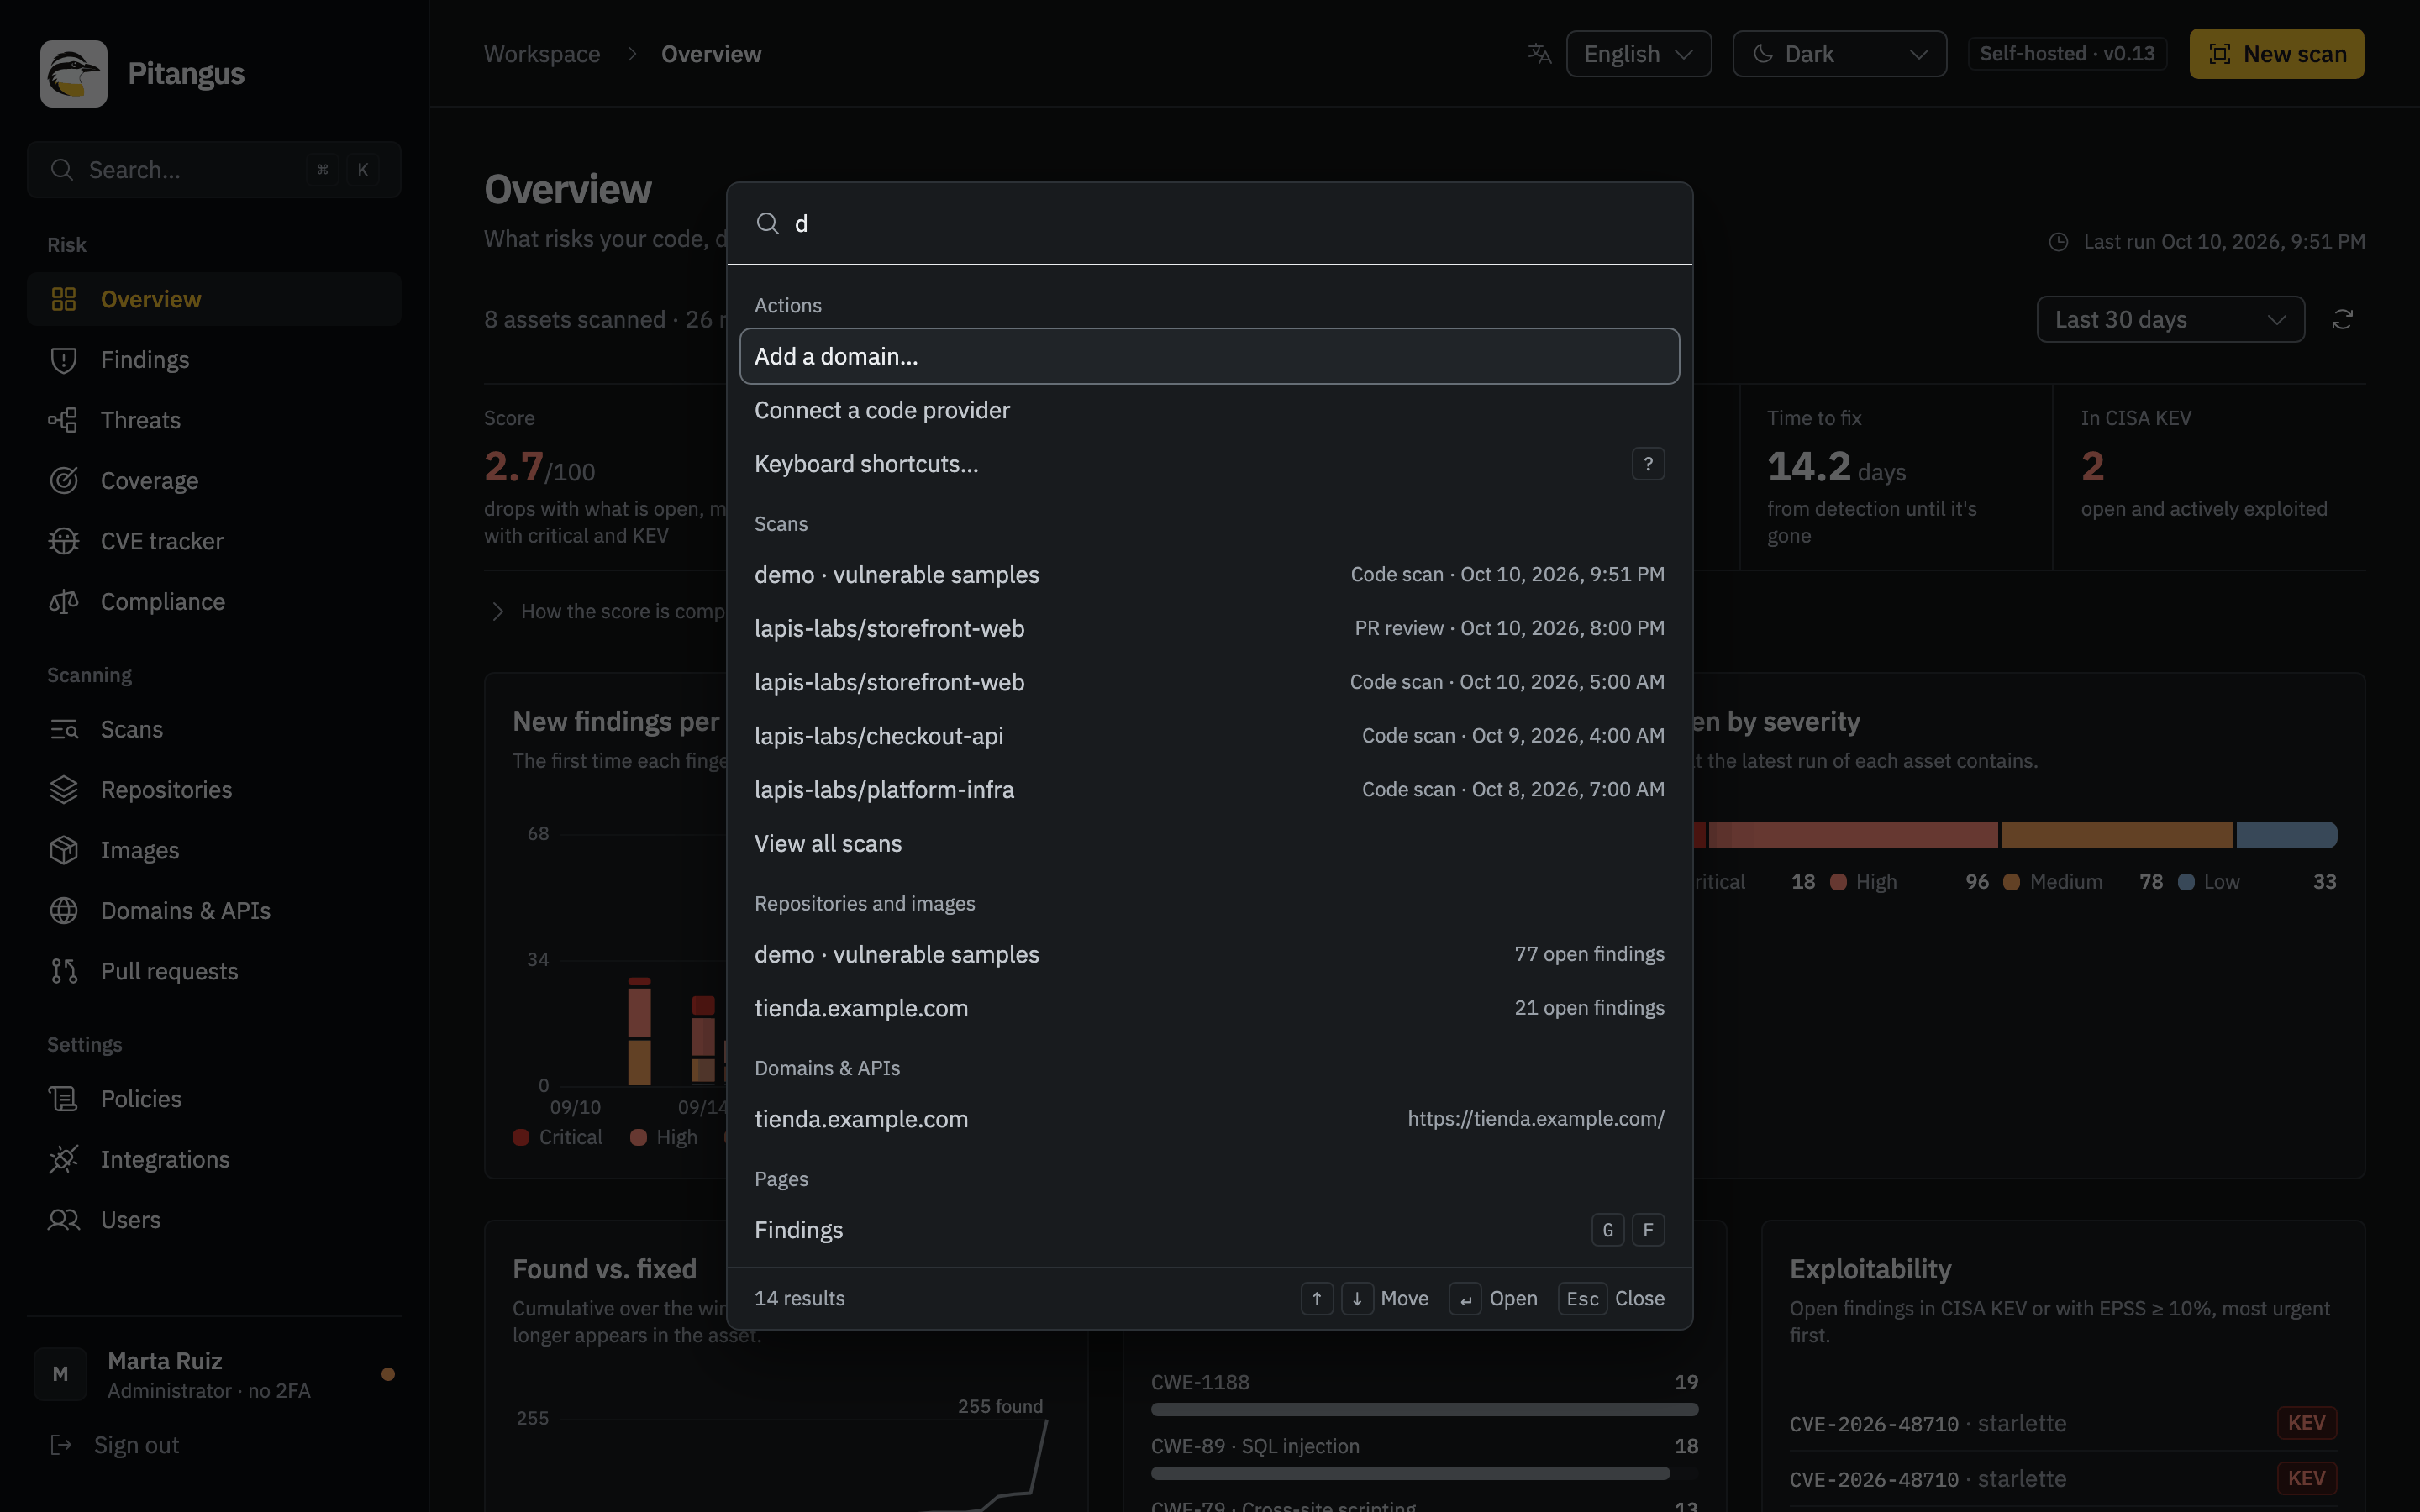
Section titled “Command palette and keyboard shortcuts”Press ⌘K on macOS or Ctrl+K elsewhere (or click Search… in the header) to open the palette. It searches pages,
scans, repositories, images and domains, and runs actions: New scan, Import SARIF results, Add a domain
(administrators), Connect a code provider and Keyboard shortcuts.
Single-key shortcuts work anywhere in the panel, except while you type in a field or a dialog is open:
| Keys | Does |
|---|---|
⌘K / Ctrl+K |
Open or close the palette |
N |
New scan |
? |
Show the shortcuts |
G then O |
Overview |
G then F |
Findings |
G then T |
Threats |
G then V |
Coverage |
G then C |
CVE tracker |
G then M |
Compliance |
G then A |
Scans |
G then R |
Repositories |
G then I |
Images |
G then D |
Domains & APIs |
G then P |
Pull requests |
G then L |
Policies |
G then E |
Integrations |
G then U |
Users (administrators) |
The letters are the same in every language.
Languages
Section titled “Languages”Everything a person reads exists in English and Spanish: the panel, findings, fix guides, reports, PR comments and
notifications. The panel follows your browser’s language, and the language switch in the header (or on the sign-in
screen) changes it. Findings are stored as message codes, not sentences, so each person reads them in their own language and
switching never needs a rescan. Text nobody requests in person (PR comments, notifications, Jira issues, the CLI) uses
PITANGUS_DEFAULT_LOCALE (en by default, see Configuration). Third-party text, such as an NVD
or GHSA advisory summary, is shown as published.
Next steps
Section titled “Next steps”- Quickstart: from zero to your first verified fix in about 15 minutes.
- Key concepts: runs, findings, fingerprints, triage and roles.
- Installation: requirements and the details of the first start.
- Frequently asked questions.