

Scan a website or API: exposure check and passive DAST (experimental)
Pitangus can look at a running website or API that you control and report what it shows to any visitor: missing security headers, weak cookies, exposed files, information leaks, an outdated TLS setup, libraries with known vulnerabilities. This is DAST (dynamic application security testing: testing the application while it runs, from the outside), and in Pitangus it is passive: the tools browse and read responses, they never attack. Every result is a finding you confirm before acting on it.
This page covers the whole path: turning web scans on, adding and verifying a domain, choosing what to scan, signing in as test users, launching or scheduling a scan, and reading what comes back.
Two checks: the exposure check, and the full scan (experimental)
Section titled “Two checks: the exposure check, and the full scan (experimental)”- Exposure check (always available to admins, for a verified domain): each host’s root and known paths only, over
HTTPS and plain HTTP on port 80, no crawl and no ZAP. httpx (what the server runs, and the status of every path it
checks), testssl.sh (TLS) and nuclei’s detection-only templates (response headers, exposed files such as
.git,.envor backups, debug and status consoles such as Spring Boot’s actuator, server-status or a Werkzeug console). The known paths come from Pitangus’ own templates (/.envand/.git/configamong them), and the paths earlier findings were on are checked again. A finding on a path the site answers exactly like a random one (the same status and the same page, even if it repeats the path: a catch-all or a “soft 404”) isn’t reported: the match says nothing about that path.//.envand/.envare one path (the tools send repeated slashes as one). Each URL is requested over its own scheme: what a plain HTTP URL answered is never its HTTPS twin’s answer, and the step counts as answered only pages it asked for. Same rules as the full scan: verified domain, pinned addresses, each tool vouching only for its own answers, a host that turned the check away leaves it incomplete. An exposure finding is only fixed by another exposure check, and an exposure check neither fixes a full scan’s findings, nor marks them unverified, nor takes them over when both report the same page: each kind of scan keeps its own findings and the date it first saw them. New analysis → Exposure check, or a domain’s own scan button. - Full web scan (experimental, off until an administrator turns it on in Settings → Analysis engines): everything below, with ZAP, katana and subfinder crawling the site. It isn’t part of the core: turning it off fixes nothing it found before, those findings stay open until a scan of the same kind proves them gone.
Passive, not active: what a scan does and doesn’t do
Section titled “Passive, not active: what a scan does and doesn’t do”A passive scan sends the same kind of requests a browser sends when someone visits the site: it follows links, loads pages and reads the answers. An active scan sends attacks (injections, fuzzing, forged form submissions) to see whether something breaks. Pitangus only runs passive scans today.
| A passive web scan in Pitangus | It doesn’t |
|---|---|
| Follows links with a crawler and a headless browser | Submit forms (except the login form of a test user you chose) |
| Reads headers, cookies, page content and TLS settings | Click buttons, type random input or guess passwords |
Requests known paths that reveal exposed files (.git, .env, backups) |
Send injections, payloads or fuzzing |
| Requests the GET and HEAD operations of an API definition | Send POST, PUT, PATCH or DELETE requests |
It is an analysis, not a pentest. A pentest (penetration test) tries to exploit flaws and proves their impact; a Pitangus report doesn’t replace the pentest that SOC 2 or ISO 27001 ask for. Because nothing is attacked, a scan with few findings doesn’t mean the application is secure: injections, broken access control and business-logic flaws are not tested. Each run lists what it left out.
Before you start
Section titled “Before you start”You need:
- An administrator account. Members see domains, their status, scope and findings; only administrators add, verify, change, remove or scan them, and only they see the verification token and the saved headers.
- The Docker runner. The scan tools run in containers. The worker image without a Docker socket
(
pitangus-worker, see containers.md) doesn’t carry them, and the run says so. - For the full scan only: an administrator turns on Full web scan in Settings → Analysis engines. It’s
experimental and off by default; the exposure check needs nothing.
PITANGUS_DAST_ENABLEDin the server’s environment pins it on (1) or off (0) over the panel; set it for both the API and the worker. See configuration.md. - The engine images.
make engines(also run bymake up) pulls the missing ones, each pinned by version and digest: nuclei, testssl.sh and httpx for the exposure check always, and ZAP, katana and subfinder too when the full scan is on. ZAP alone is about 1.2 GB; the other web tools about 1 GB together.make engines LIST=1lists what it would pull, without pulling. - A public HTTPS site on port 443, with a valid certificate and a public DNS name. Private and internal addresses are never scanned.
For the full scan, turn it on in Settings → Analysis engines: the worker downloads its images (and katana’s) right away, and the row says when they’re ready. From the command line instead, pin it on and pull them:
echo 'PITANGUS_DAST_ENABLED=1' >> .envmake upmake enginesThe first make engines shows each image it pulls, for example:
Engines: 3 images missing; the first time can take a while depending on your connection.→ ghcr.io/zaproxy/zaproxy:2.17.0→ projectdiscovery/subfinder:v2.16.0→ projectdiscovery/katana:v1.7.0Engines: ready.When everything is present it prints Engines: all images are ready. The first scan also downloads the nuclei
templates release once from GitHub (its SHA-256 is pinned).
Add a domain
Section titled “Add a domain”- Open Scanning → Domains & APIs (
#/domains) and click Add domain. - Type the site’s address, for example
https://app.example.com: HTTPS, a public domain, no port, query, fragment or user. While you type, the panel probes it and says whether it responds (Responds · HTTPS 200) or not yet. You can add it either way. - Pick a Type: Web app, API or Inventory only (listed, never scanned). Optionally add a Context (what it does, how users sign in, the data it handles); it’s shown in reports.
- Click Add domain. The verification dialog opens next.
The probe checks that the name resolves to public addresses only (nothing is sent otherwise) and sends one HEAD
over HTTPS to the address it just resolved, with a valid certificate and no redirects. Adding, probing and verifying
don’t test anything. A workspace keeps at most 20 domains.
When web scans are on, adding a domain also starts the search for related hosts.
Verify that you control it
Section titled “Verify that you control it”A domain can’t be scanned until you prove control of it. There are three methods, all with the same token. The verification dialog shows the exact values to copy for each one (tabs DNS record, File and Meta tag).
| Method | What you publish | What it covers |
|---|---|---|
| DNS (recommended) | A TXT record named _pitangus.<host> with the value pitangus-verify=<token> |
The host and its subdomains |
| File | https://<host>/.well-known/pitangus-verify.txt, answering 200 with the token in its body |
That exact host |
| Meta tag | <meta name="pitangus-verify" content="<token>"> in the <head> of https://<host>/ |
That exact host |
Only a DNS proof lets scans include subdomains: whoever controls the zone controls them.
DNS record
Section titled “DNS record”Add the TXT record at your DNS provider. For app.example.com it looks like this in zone-file form:
_pitangus.app.example.com. 300 IN TXT "pitangus-verify=3q2-7wEXAMPLEtokenVALUE0abcd1234"Check that it’s published before you click Verify now:
dig +short TXT _pitangus.app.example.com"pitangus-verify=3q2-7wEXAMPLEtokenVALUE0abcd1234"Pitangus asks the zone’s own authoritative nameservers first, so a resolver that cached “no such record” doesn’t hold you back; it falls back to the local resolver on networks that only allow DNS through it.
File or meta tag
Section titled “File or meta tag”Publish the file (the dialog has Download file) or add the tag to the homepage, then check it from outside:
curl -sS https://app.example.com/.well-known/pitangus-verify.txtPitangus fetches the file or the homepage once, from the host’s checked public address (never a private one), over
HTTPS with a valid certificate, without following redirects, with 10 seconds and 64 KB at most. Serve the proof
from that exact host: a redirect to www. or to a login page fails the check.
How long it lasts
Section titled “How long it lasts”A proof counts for 90 days. Every day Pitangus asks for the same proof again (the method that verified it):
- Still there: the 90 days start again.
- Gone: the domain stops being verified at once, scheduled scans pause, and someone must verify it again.
- DNS or the host doesn’t answer: nothing changes until the 90 days run out.
The worker also checks the proof right before every scan.
When verification fails
Section titled “When verification fails”| Message | What to do |
|---|---|
No TXT record found at _pitangus.<host> yet |
Check the record’s name (some providers add the domain for you, giving _pitangus.app.example.com.example.com), its value and wait for propagation; try again in a few minutes. |
| Couldn’t query DNS | The server couldn’t reach DNS. Check its network and try again; nothing is changed. |
<url> answered with a redirect |
Serve the file or the tag from that exact host without redirecting. |
<url> doesn’t contain this domain’s token |
Publish the file with the token and make sure it answers 200. |
The homepage of <host> has no pitangus-verify meta tag |
Add the tag to the homepage’s <head> (not to another page). |
Couldn’t reach <host> over HTTPS |
The site must answer on port 443 with a valid certificate. |
| Too many attempts for this domain | Wait the seconds it says before trying again. |
Choose the scope: subdomains and related hosts
Section titled “Choose the scope: subdomains and related hosts”The scope is the set of hosts a scan may reach. By default it’s the domain’s own host. With a current DNS proof you can add subdomains.
Related hosts found for you
Section titled “Related hosts found for you”When a domain is added (and when you click Search again in its Scope tab), Pitangus runs subfinder, a tool that looks for names under the domain in public sources only: certificate transparency logs, passive DNS and archives. It uses no API keys and stops after one minute. Nothing is sent to your hosts; your domain’s name is sent to those public sources, which is why discovery only runs with the full web scan on.
Each name found must be a valid host under the domain and resolve to public addresses only (no private, loopback, link-local or cloud metadata addresses); the rest is dropped and counted. New hosts start excluded.
Mark what to analyze
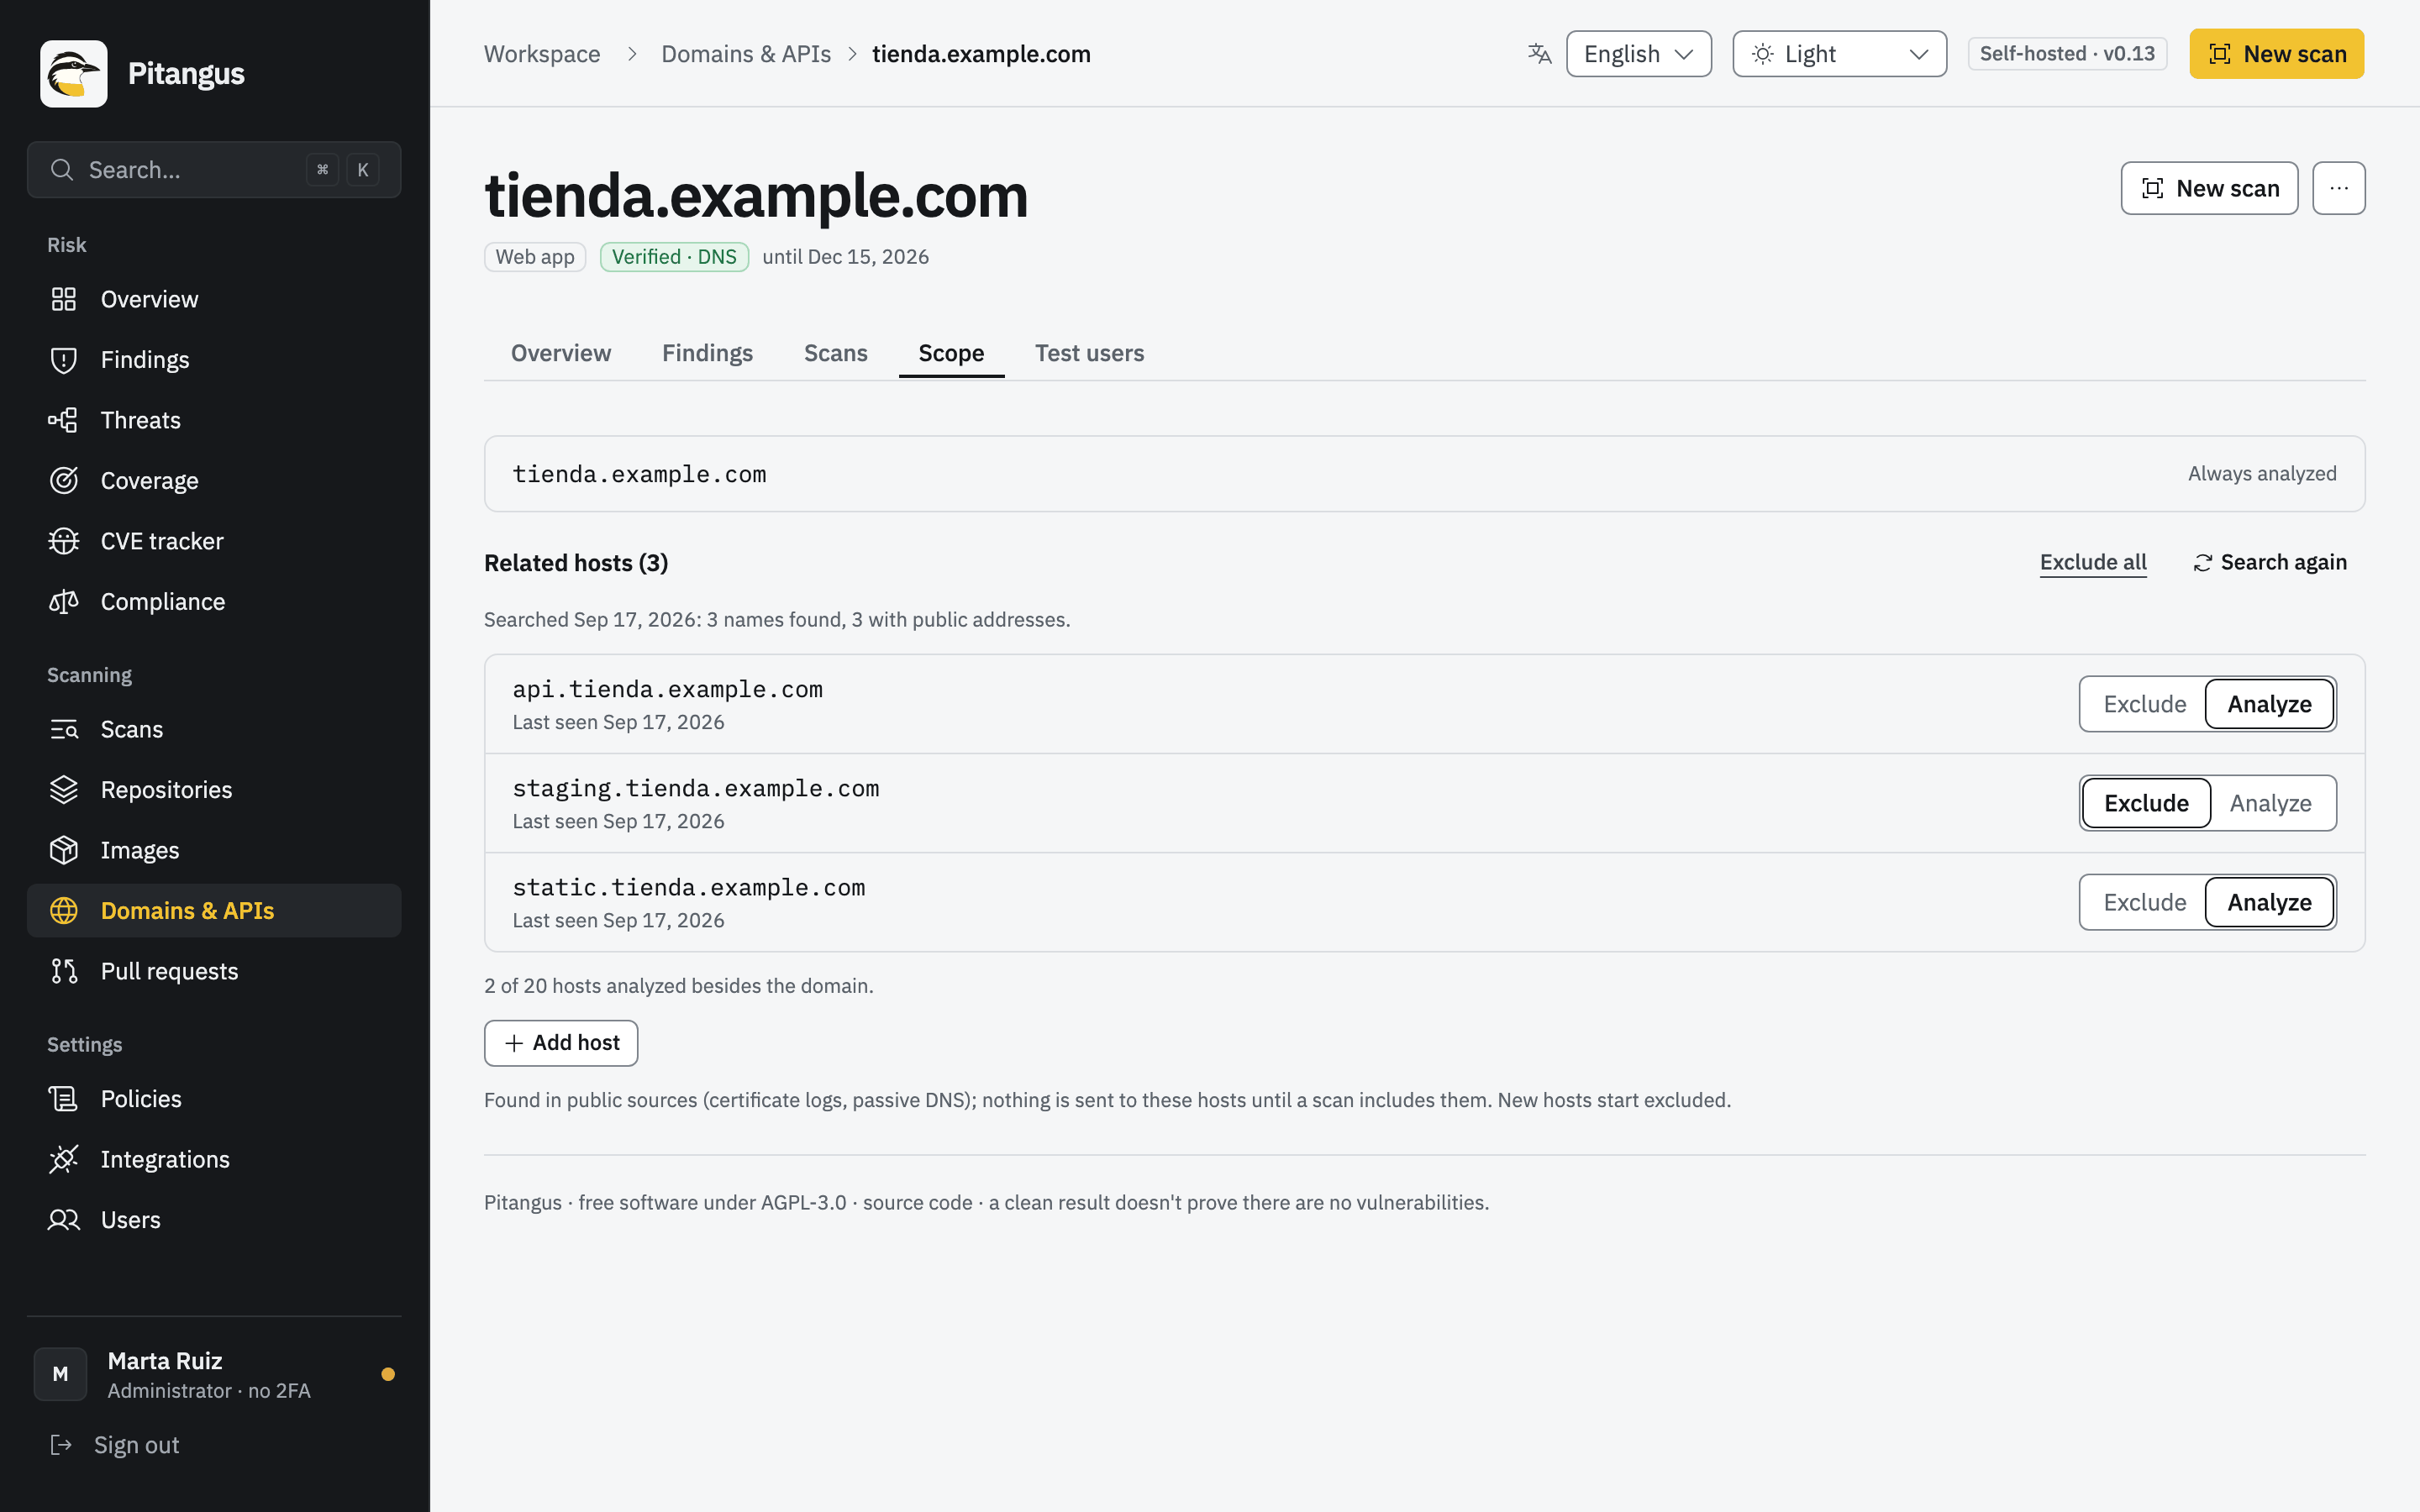
Section titled “Mark what to analyze”In the domain’s Scope tab (#/domain?id=…&tab=scope), or with Include subdomains in a new scan, an
administrator marks each host Analyze or Exclude, or adds one by hand with Add host. The choice is saved
with the domain and every scan that uses the saved scope reads it when it starts: analyzed hosts are crawled,
excluded ones are kept out of ZAP’s context.
| Limit | Value |
|---|---|
| Hosts analyzed besides the domain | 20 |
| Related hosts listed per domain | 100 |
| Proof needed to include any subdomain | A current DNS proof |
Without a DNS proof the hosts are listed but disabled, and scans reach the domain’s own host only. When Docker, the subfinder image or a connection is missing, the tab says why.
Through the API a scan can instead list subdomains for that scan only (hosts: up to 20 names or *. wildcards). A
wildcard only widens ZAP’s context: hosts reached through it aren’t resolved, so they aren’t analyzed. List a host by
name to include it.
Reach pages behind a login
Section titled “Reach pages behind a login”Without credentials a scan only sees public pages. You can give it access two ways, and both are optional.
Request headers
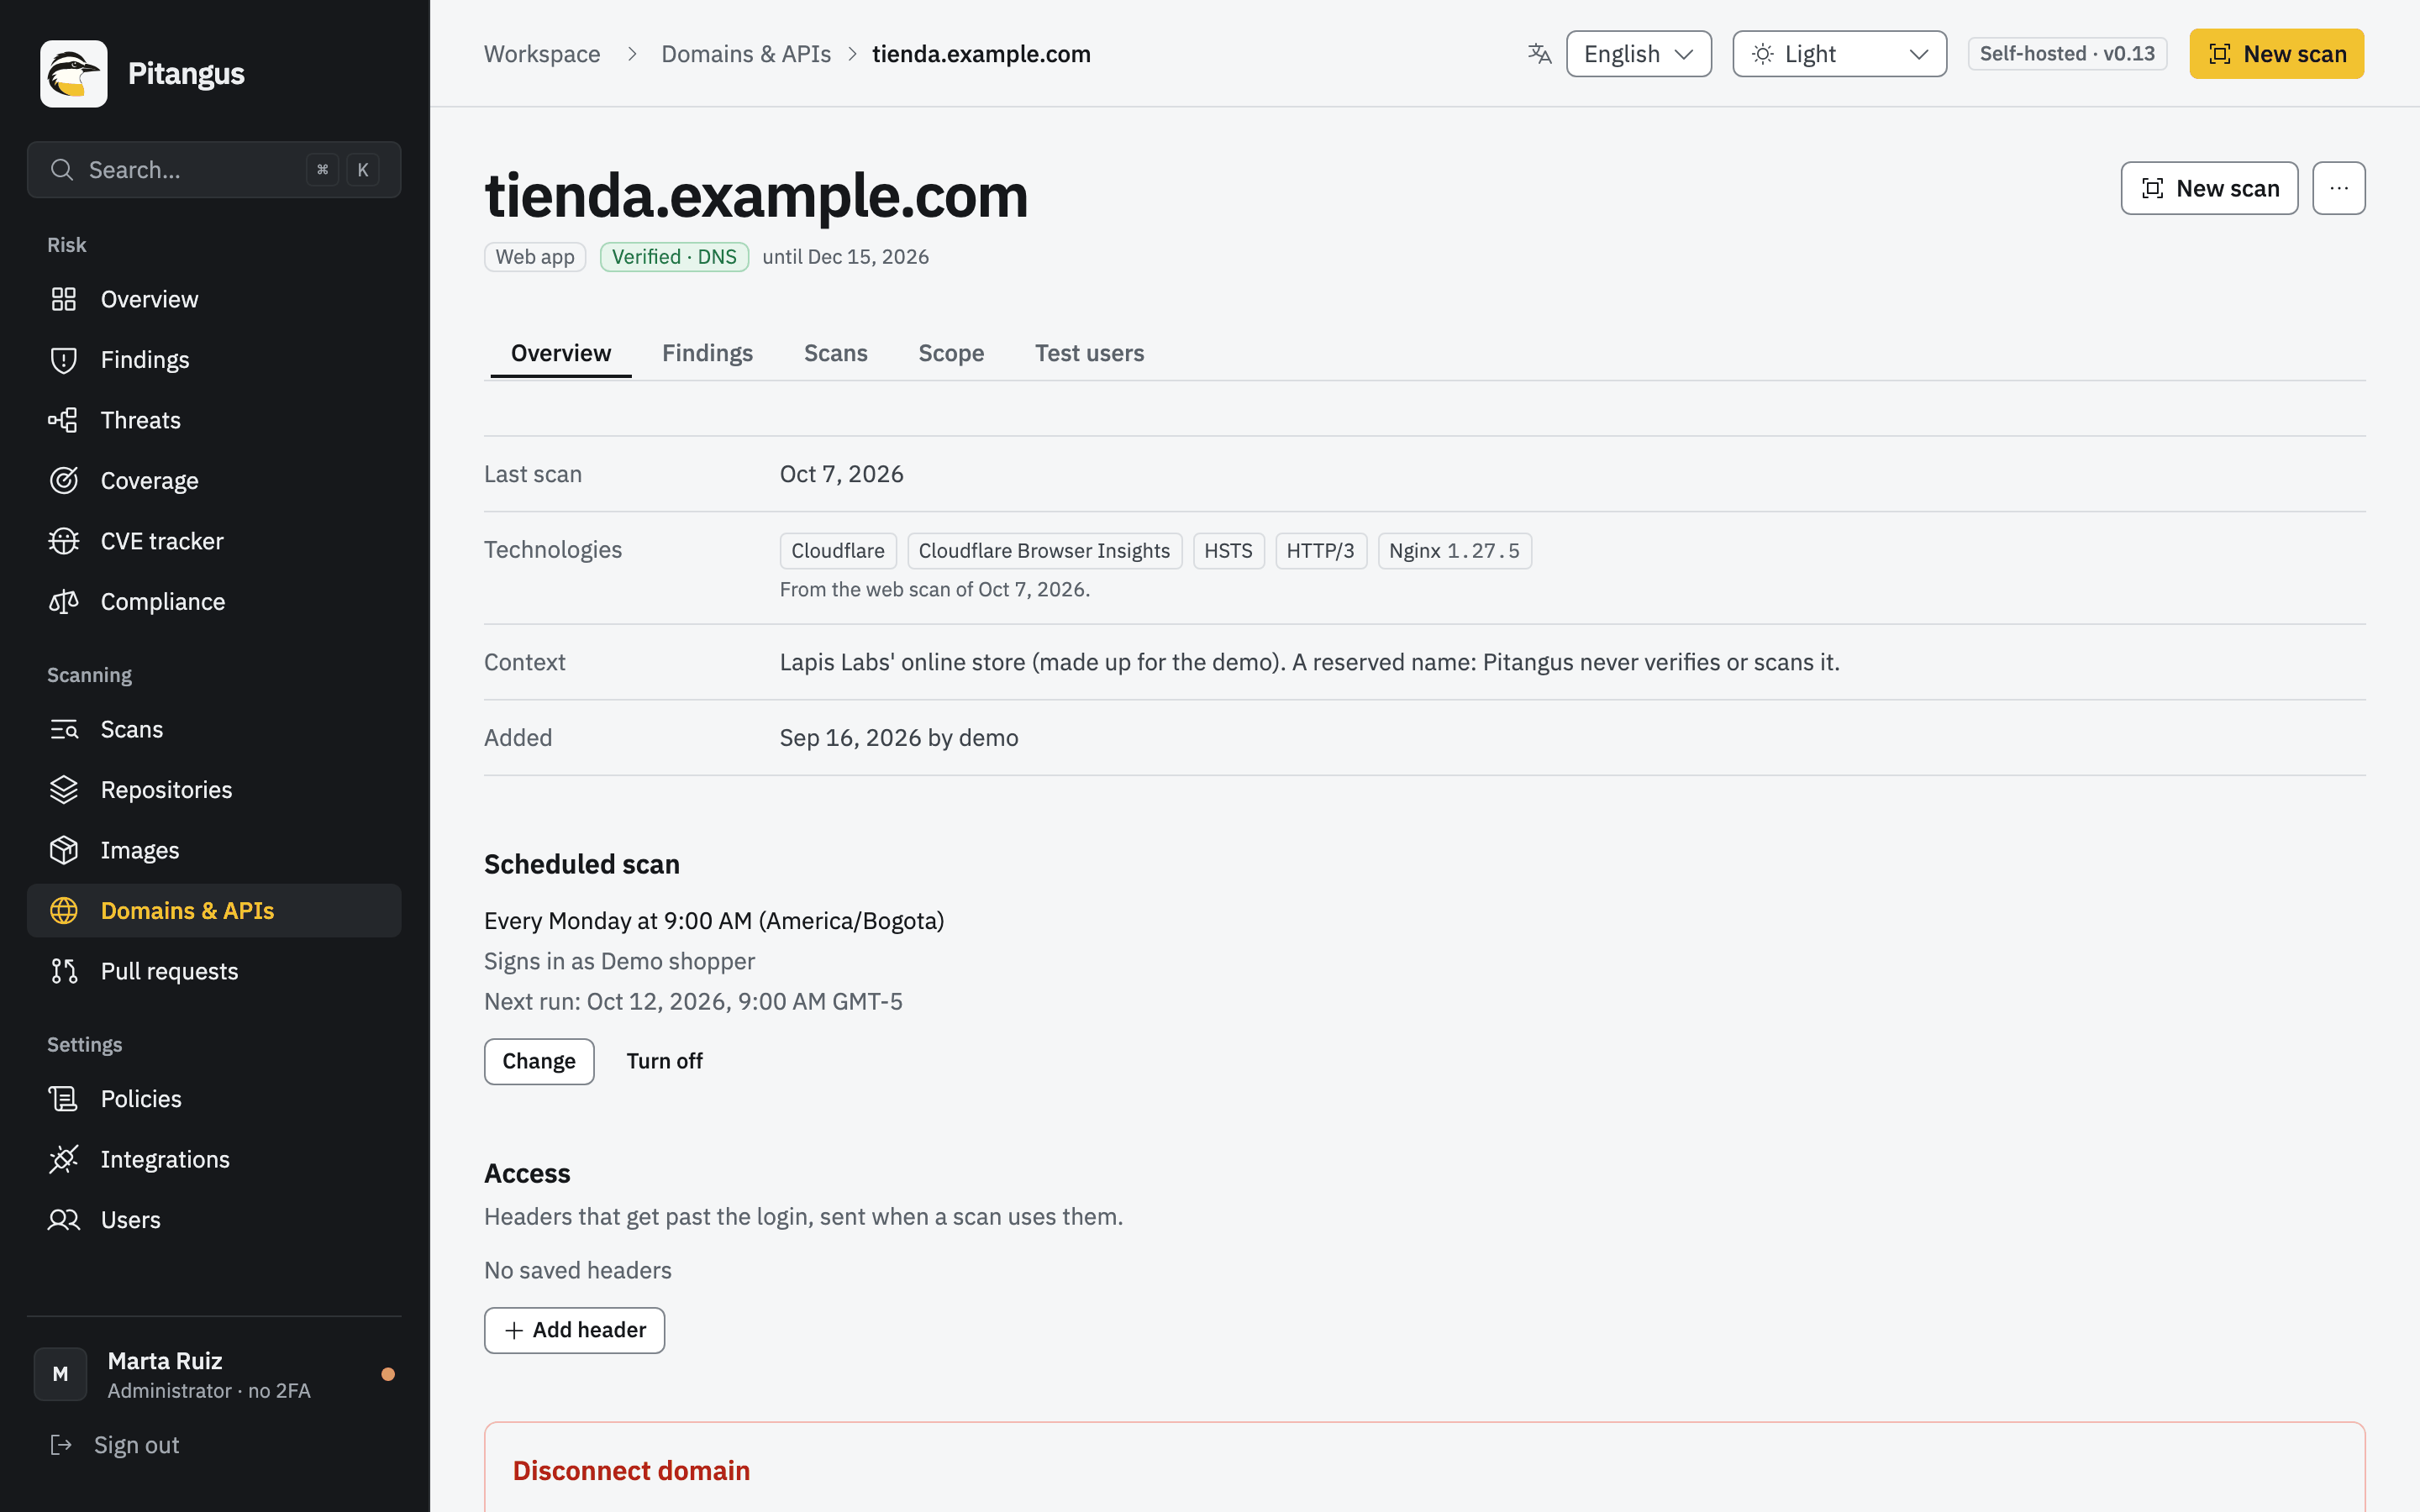
Section titled “Request headers”An administrator can save up to 10 headers per domain (an API key, a bearer token, a session cookie) under Access on the domain’s Overview. They’re stored encrypted and never shown again: the panel lists their names, the last four characters of long values and when they were saved.
- A scan sends them only when asked (Send the saved headers), and only to the scope’s hosts.
- ZAP, katana and nuclei send them; testssl.sh and httpx don’t.
- Names follow HTTP’s token rules;
Host,Content-Lengthand hop-by-hop headers are refused. Values are one line of printable ASCII, 4096 characters at most. - Values never reach the run, its progress, the logs, the findings or a file on disk.
A header can stop signing in while nobody looks (a cookie expires, a token is revoked), and the scan would then see only
the public pages. Under the headers, Session check page takes an HTTPS page of the domain (or one of its subdomains)
that only opens signed in, such as https://app.example.com/account. A scan that sends the headers asks for it with them
before it starts and again when it ends, from the host’s pinned address and without following redirects:
- A 2xx both times: the step Session of the saved headers is complete.
- A redirect (to the login), a 401 or 403, no answer, or a page on a host outside the scan’s scope: the step is Partial and the run Incomplete, so it marks nothing fixed.
Without a session check page, nobody proves the headers still sign in: the run says so in its limitations, and it marks nothing it found with them fixed (what was behind the login may simply not have been reached).
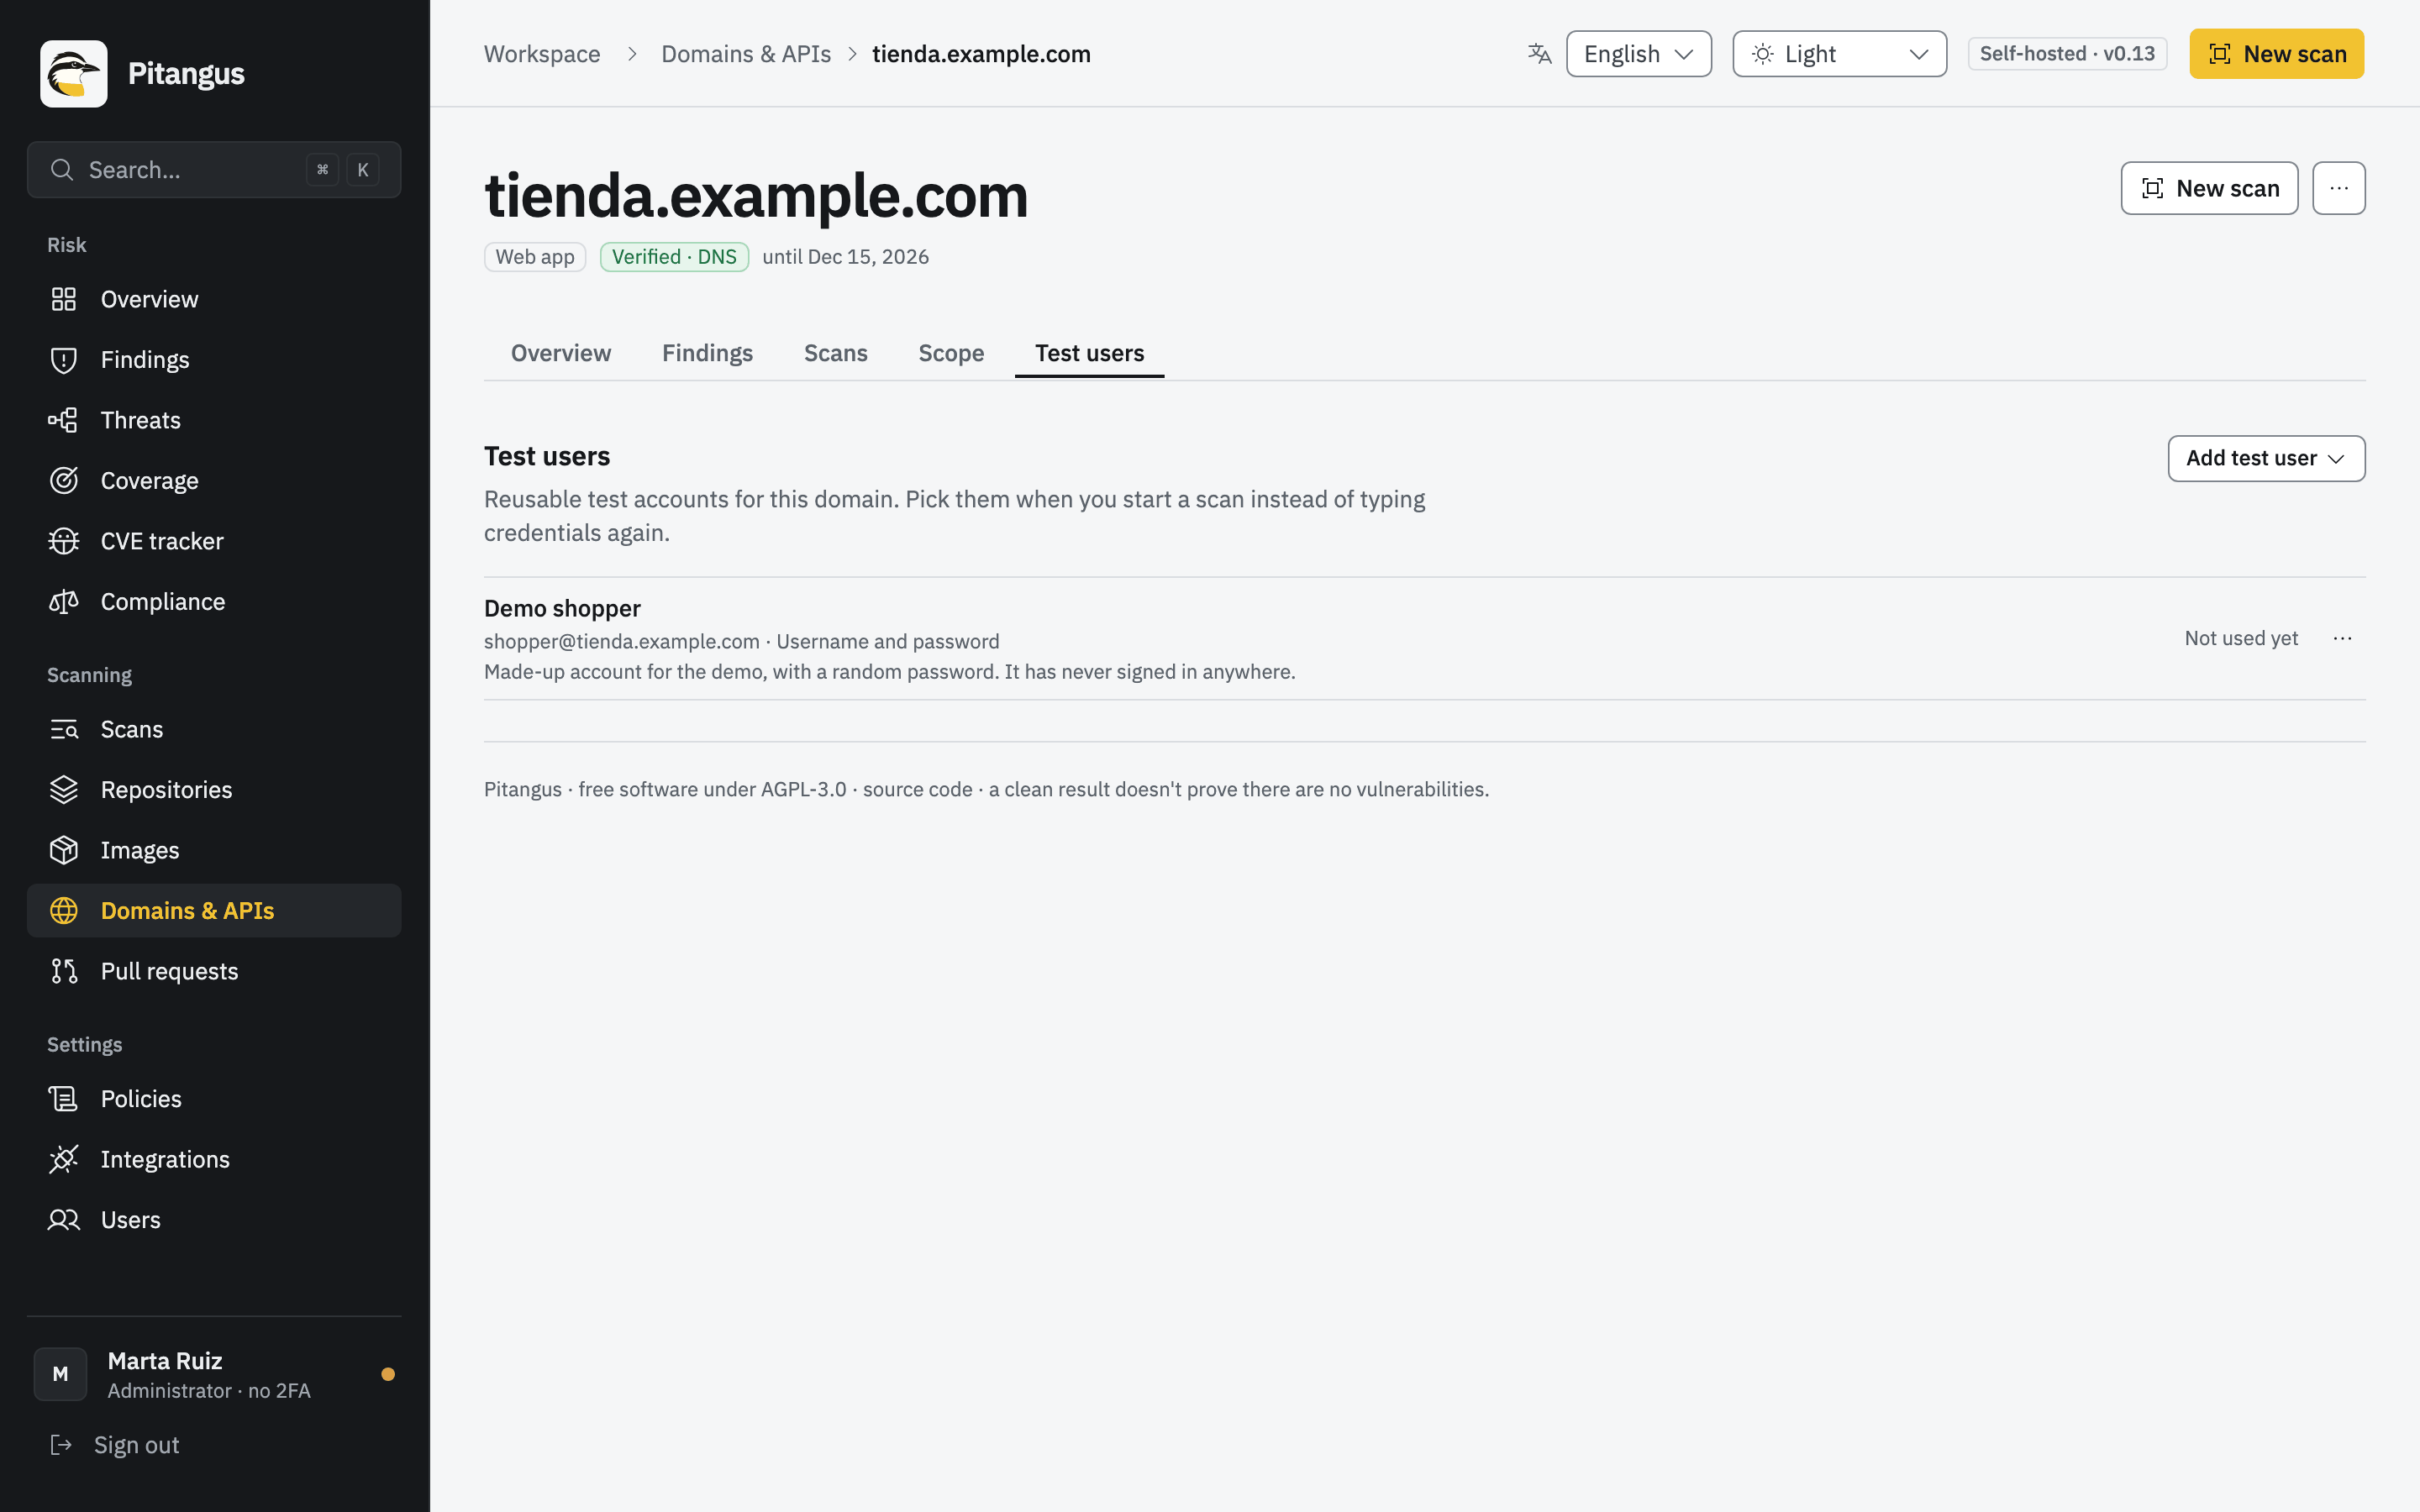
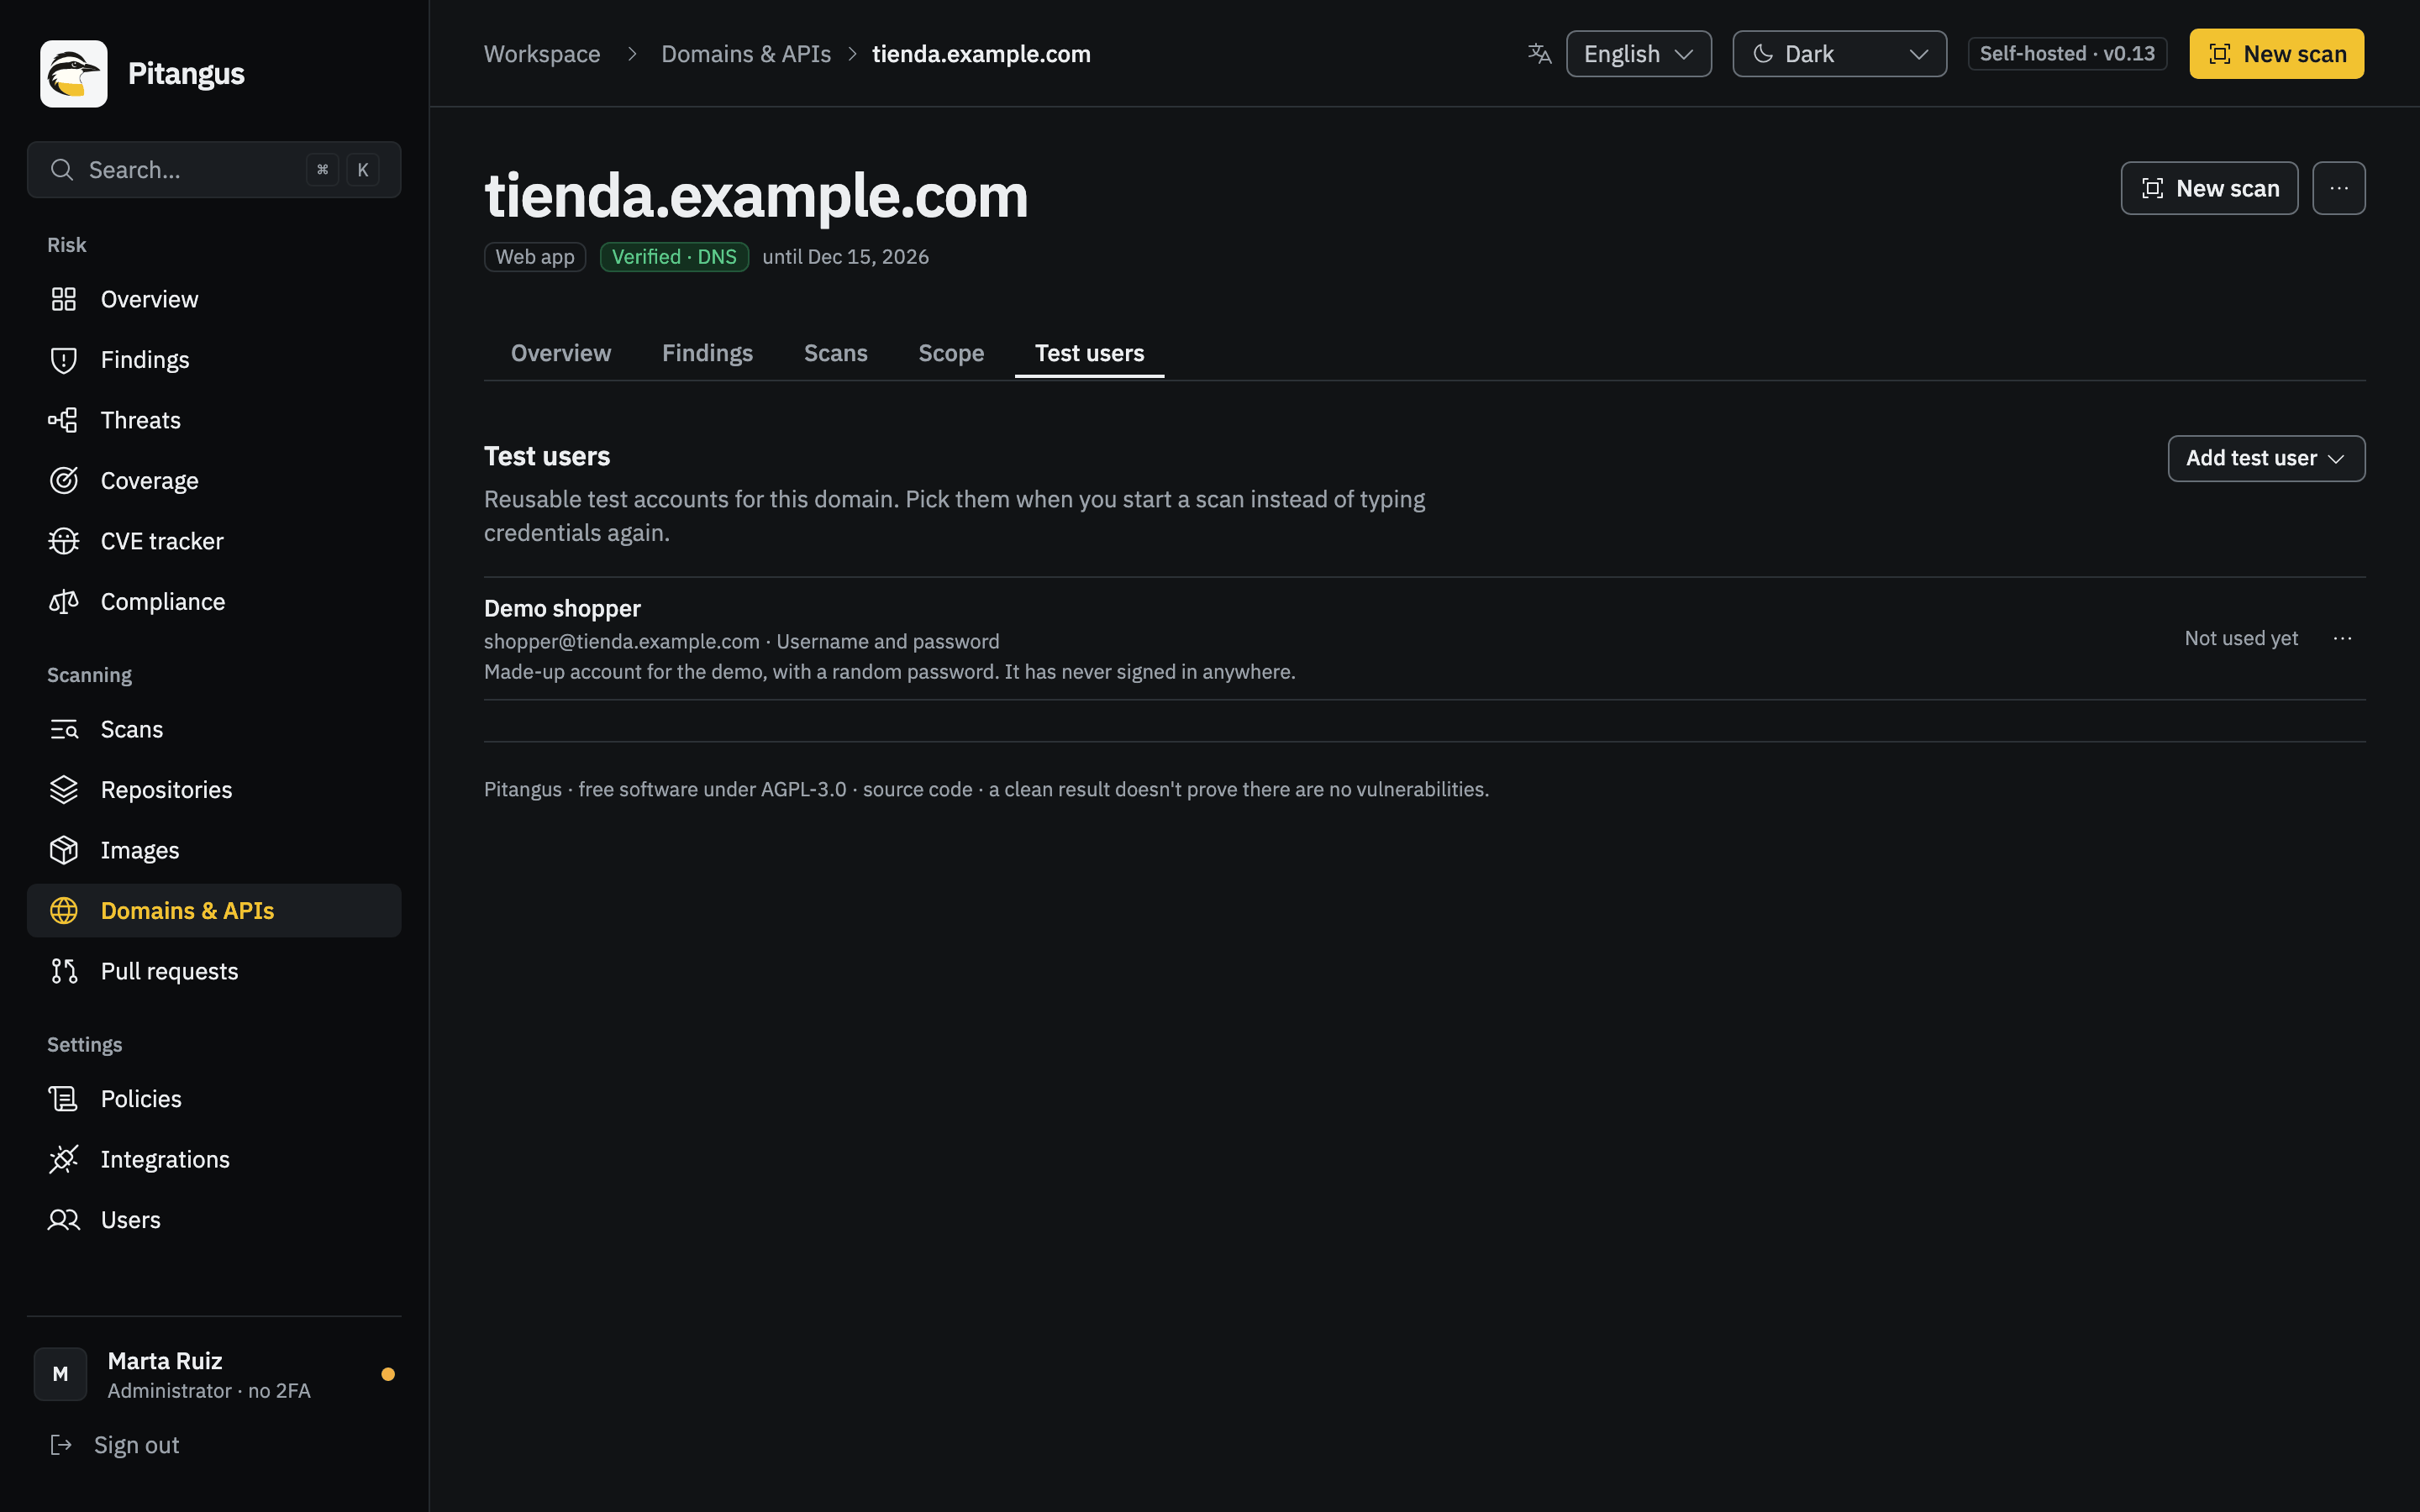
Test users
Section titled “Test users”A test user is an account on your application that the scan signs in with, so it can see what a signed-in user sees. Use dedicated test accounts, not real people’s.
In the domain’s Test users tab (#/domain?id=…&tab=users), click Add test user and fill in:
| Field | Notes |
|---|---|
| Name | How you’ll recognize it, such as “Admin user”. |
| Method | Username and password, or Authenticator app (TOTP) for accounts with two-step sign-in. |
| Username or email, Password | Encrypted; the password can’t be read again, only replaced. |
| Authenticator key (TOTP secret) | The base32 key shown when you set up the authenticator (at least 16 characters); 6–8 digits, 15–120 seconds, SHA1, SHA256 or SHA512. |
| Login URL (optional) | Where signing in starts. Blank: the scan opens the host’s homepage and follows the login link it finds. |
| Check URL (optional) | A page only a signed-in user sees, such as /account. |
| Applies to | The host the account belongs to: the domain or one of its subdomains. |
| Notes (optional) | Free text. |
A domain keeps up to 10 test users and a scan signs in with up to 3. Codes sent by email and magic links
aren’t supported: nobody reads that inbox. A password, key or URL containing ${ is refused.
How the sign-in is checked
Section titled “How the sign-in is checked”Before crawling, each chosen test user signs in alone, in a ZAP of its own, through a headless Firefox (ZAP’s browser-based authentication; with TOTP the code goes into the field after the password). Then:
- With a check URL, ZAP requests it as that user. Anything but a 200 (a redirect to the login, a 401, a 403) is a failed sign-in.
- Without one, ZAP’s own authentication report decides.
The run then says Signed in as «name» or Couldn’t sign in as «name» with the reason (ZAP’s own words when it gave them).
When a sign-in fails
Section titled “When a sign-in fails”A user who couldn’t sign in isn’t crawled as. The scan goes on with the others and anonymously, and the run is marked incomplete with partial coverage, next to its results, in its limitations and in its reports. Few or no findings behind that login therefore never read as “clean”. Each user who signed in gets a crawl of its own (2 minutes, plus an AJAX spider of 2 more).
Only ZAP signs in. katana, nuclei, testssl.sh and httpx look at the site anonymously.
Secrets never reach ZAP through its plan, a command line, a file on the host or docker inspect: they travel on the
container’s standard input and are scrubbed from what ZAP returns.
Launch a scan
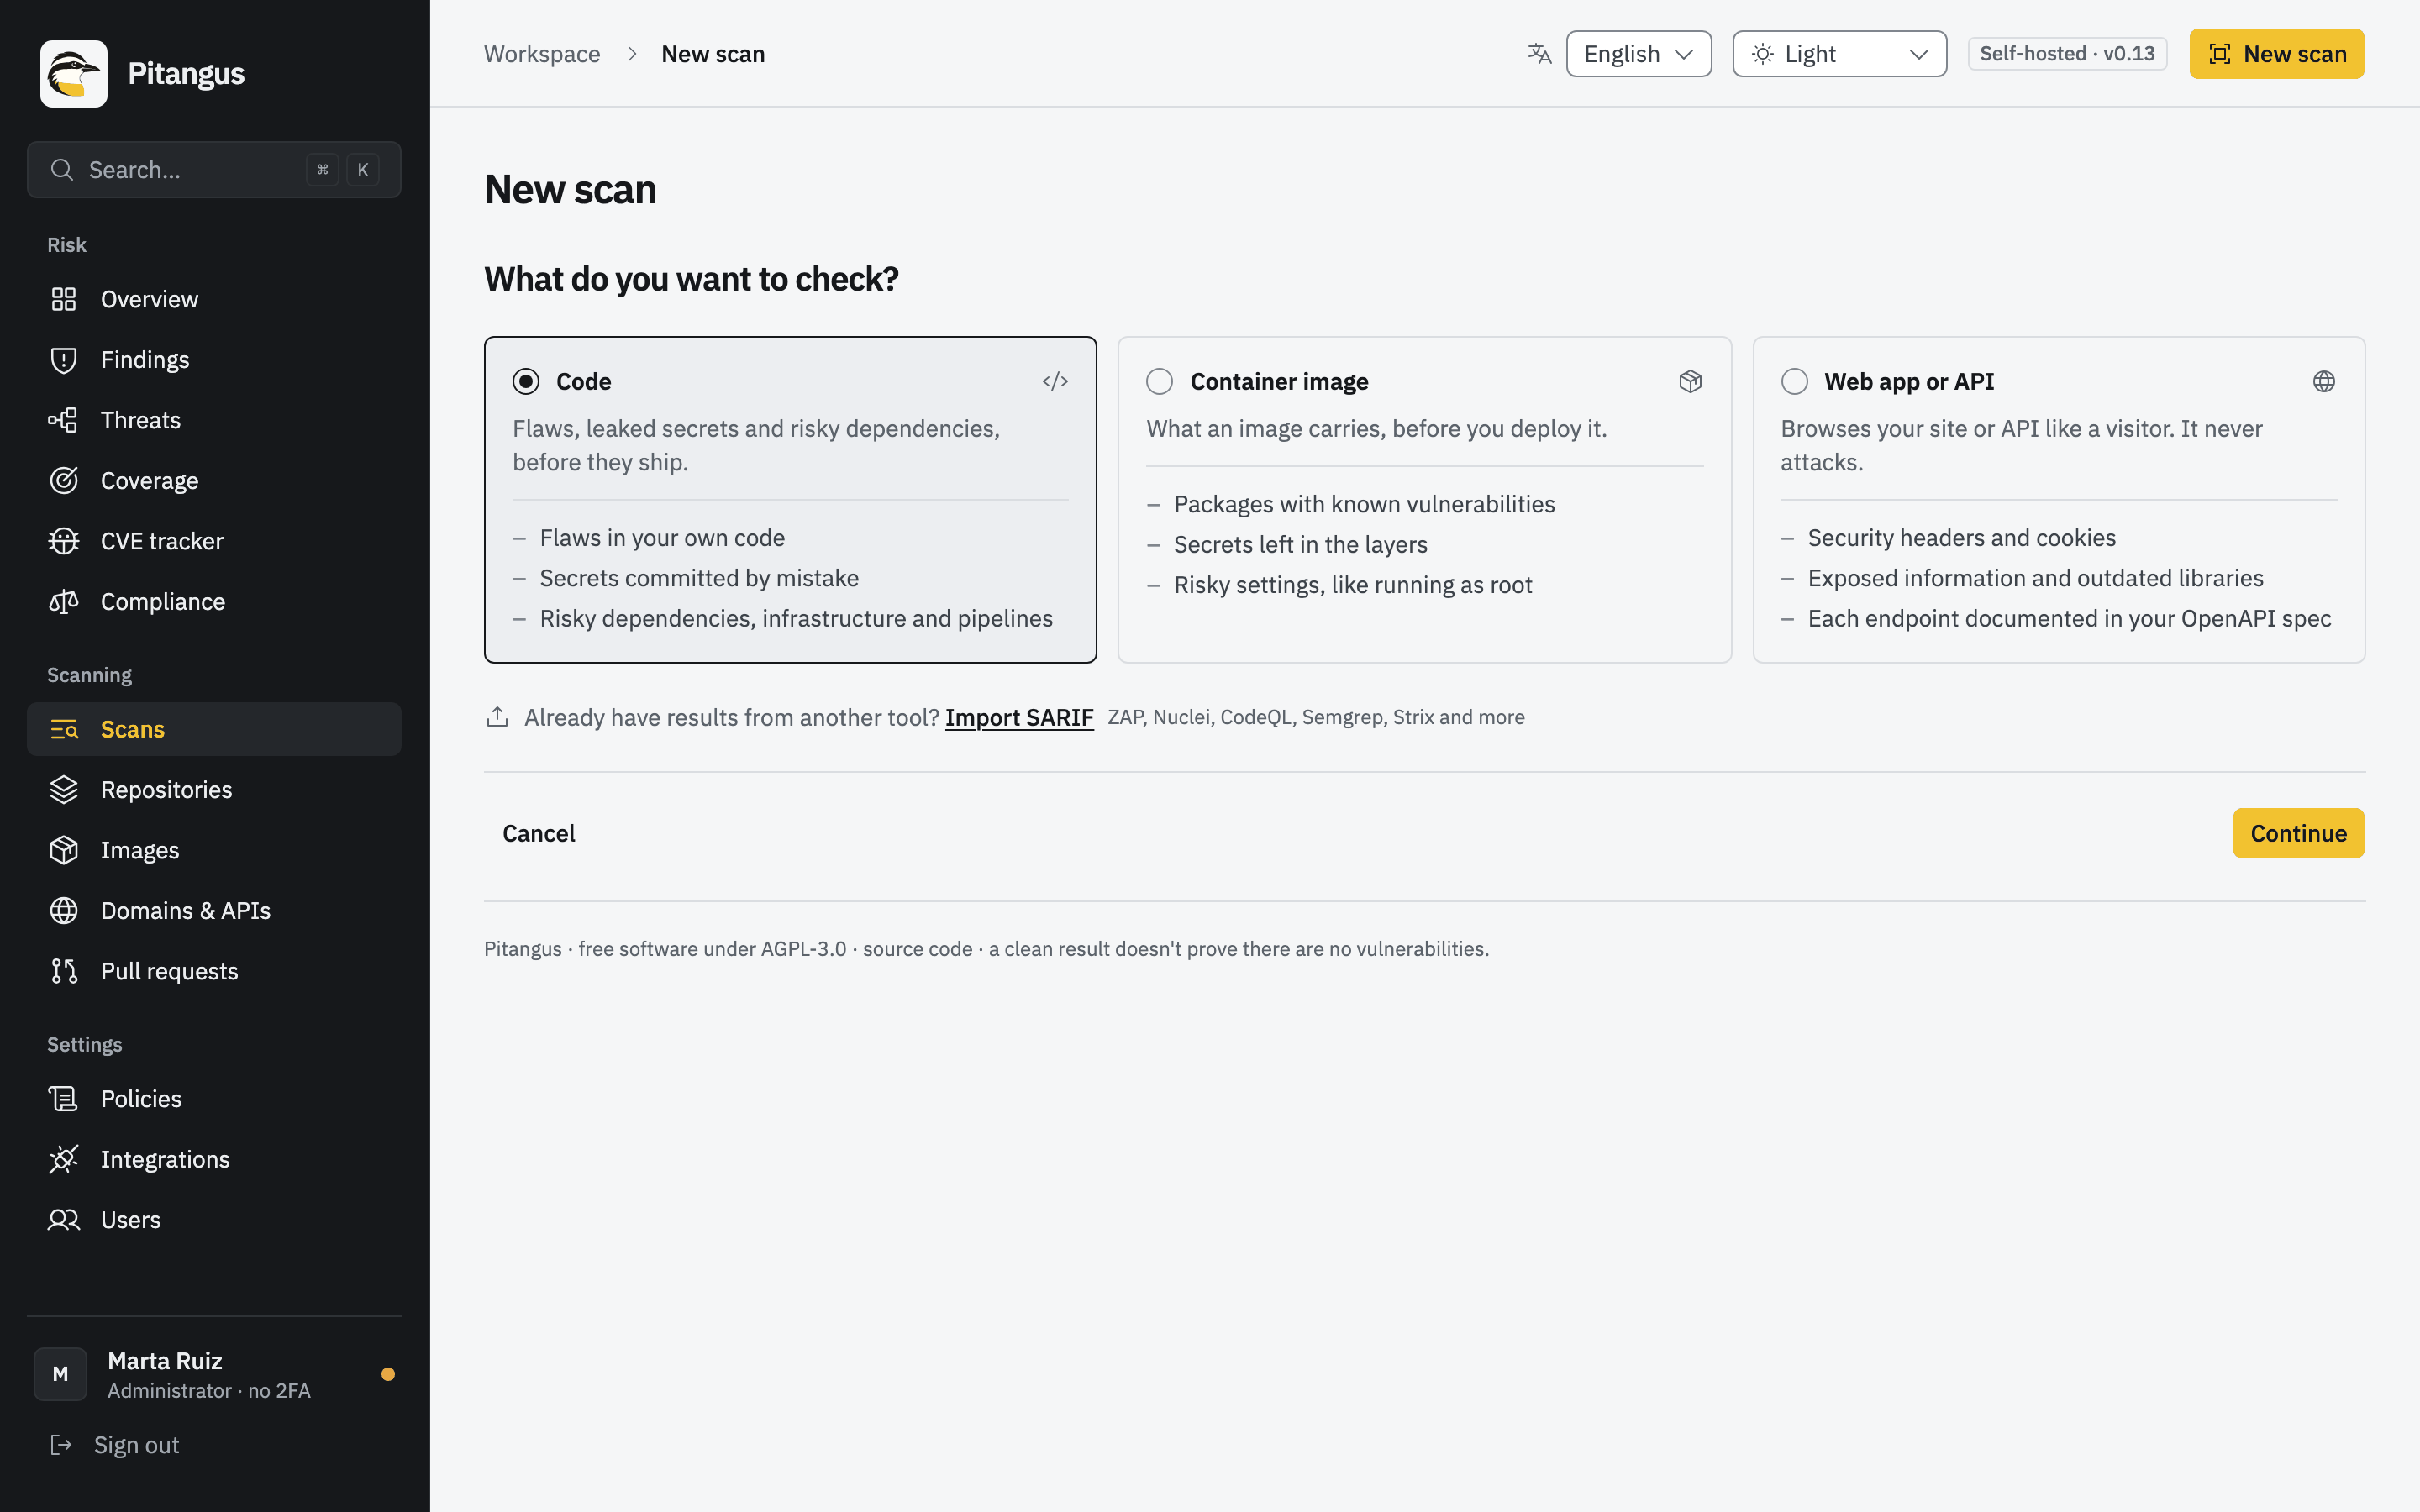
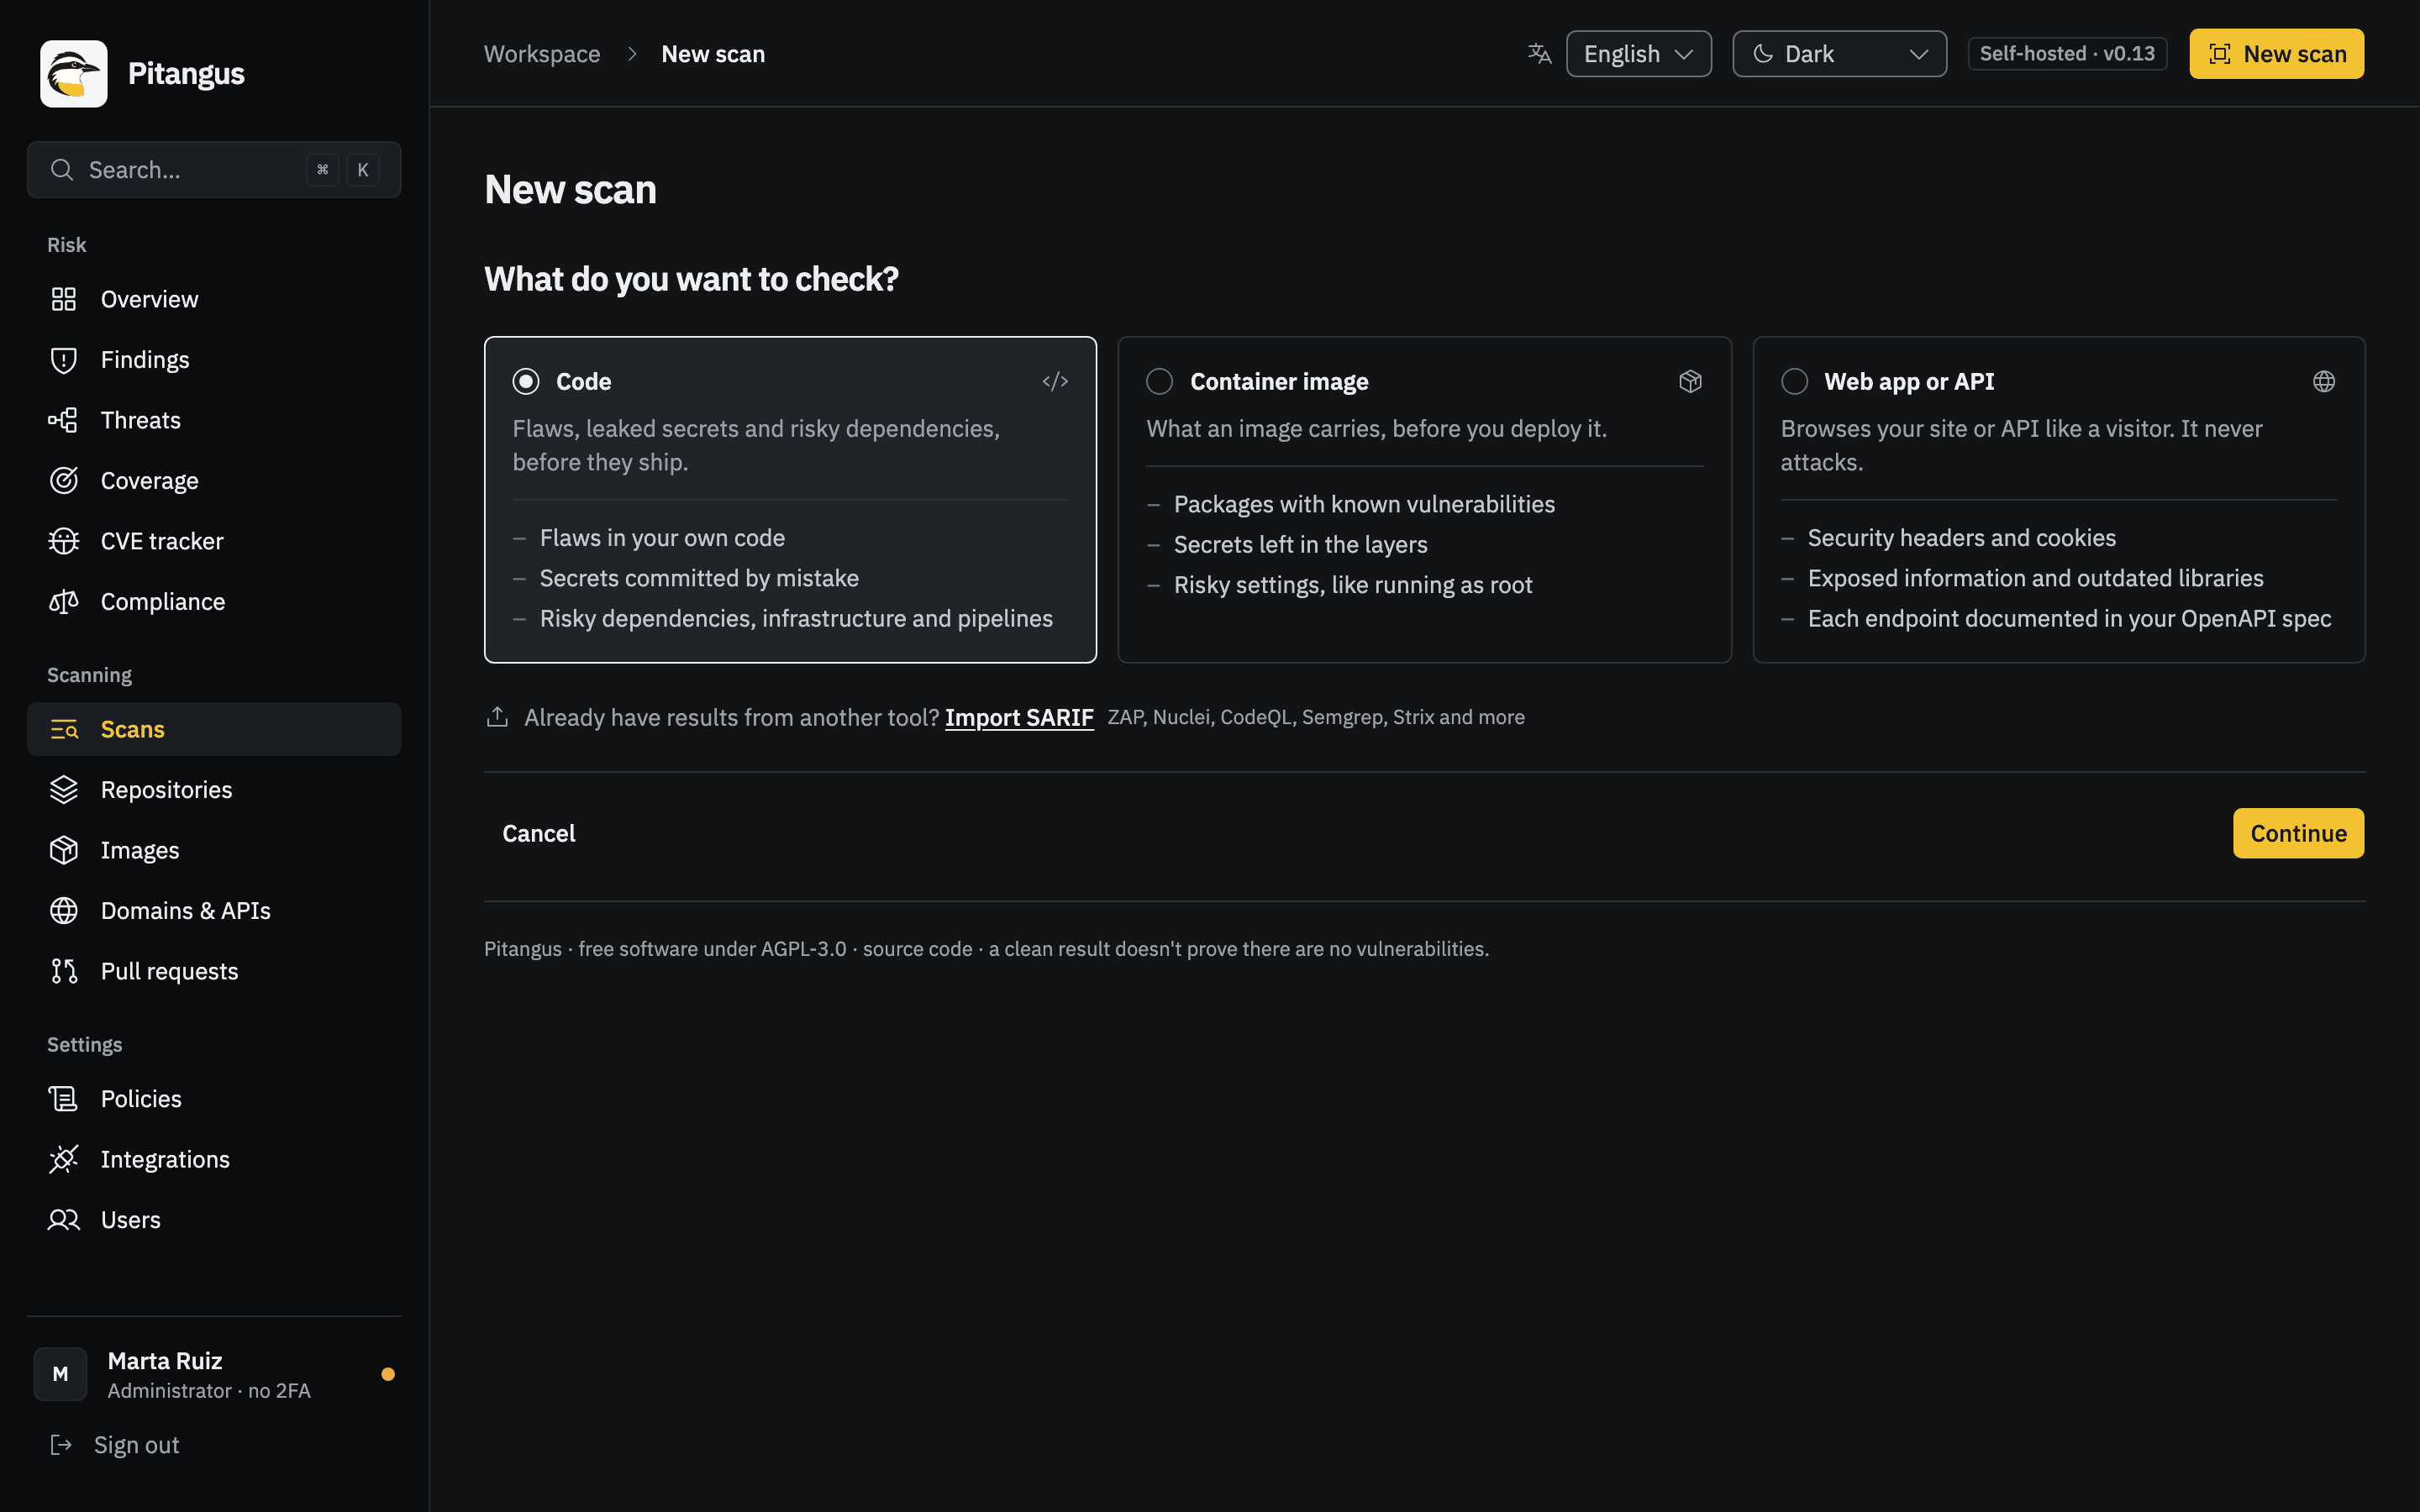
Section titled “Launch a scan”- Click New scan (
#/new) and choose Full web scan (or Exposure check, which only requests each host’s root and known paths). If the full scan says Not enabled on this server, see Common errors. - Target: pick a verified domain. Turn on Include subdomains to use the saved scope (the hosts you mark Analyze here are saved for its next scans). For an API, add its API documentation (see API mode).
- Access: pick up to 3 test users and, if the domain has them, Send the saved headers. A test user who signs in on a host outside this scan’s scope can’t be picked. With neither, Pitangus asks you to confirm Public pages only.
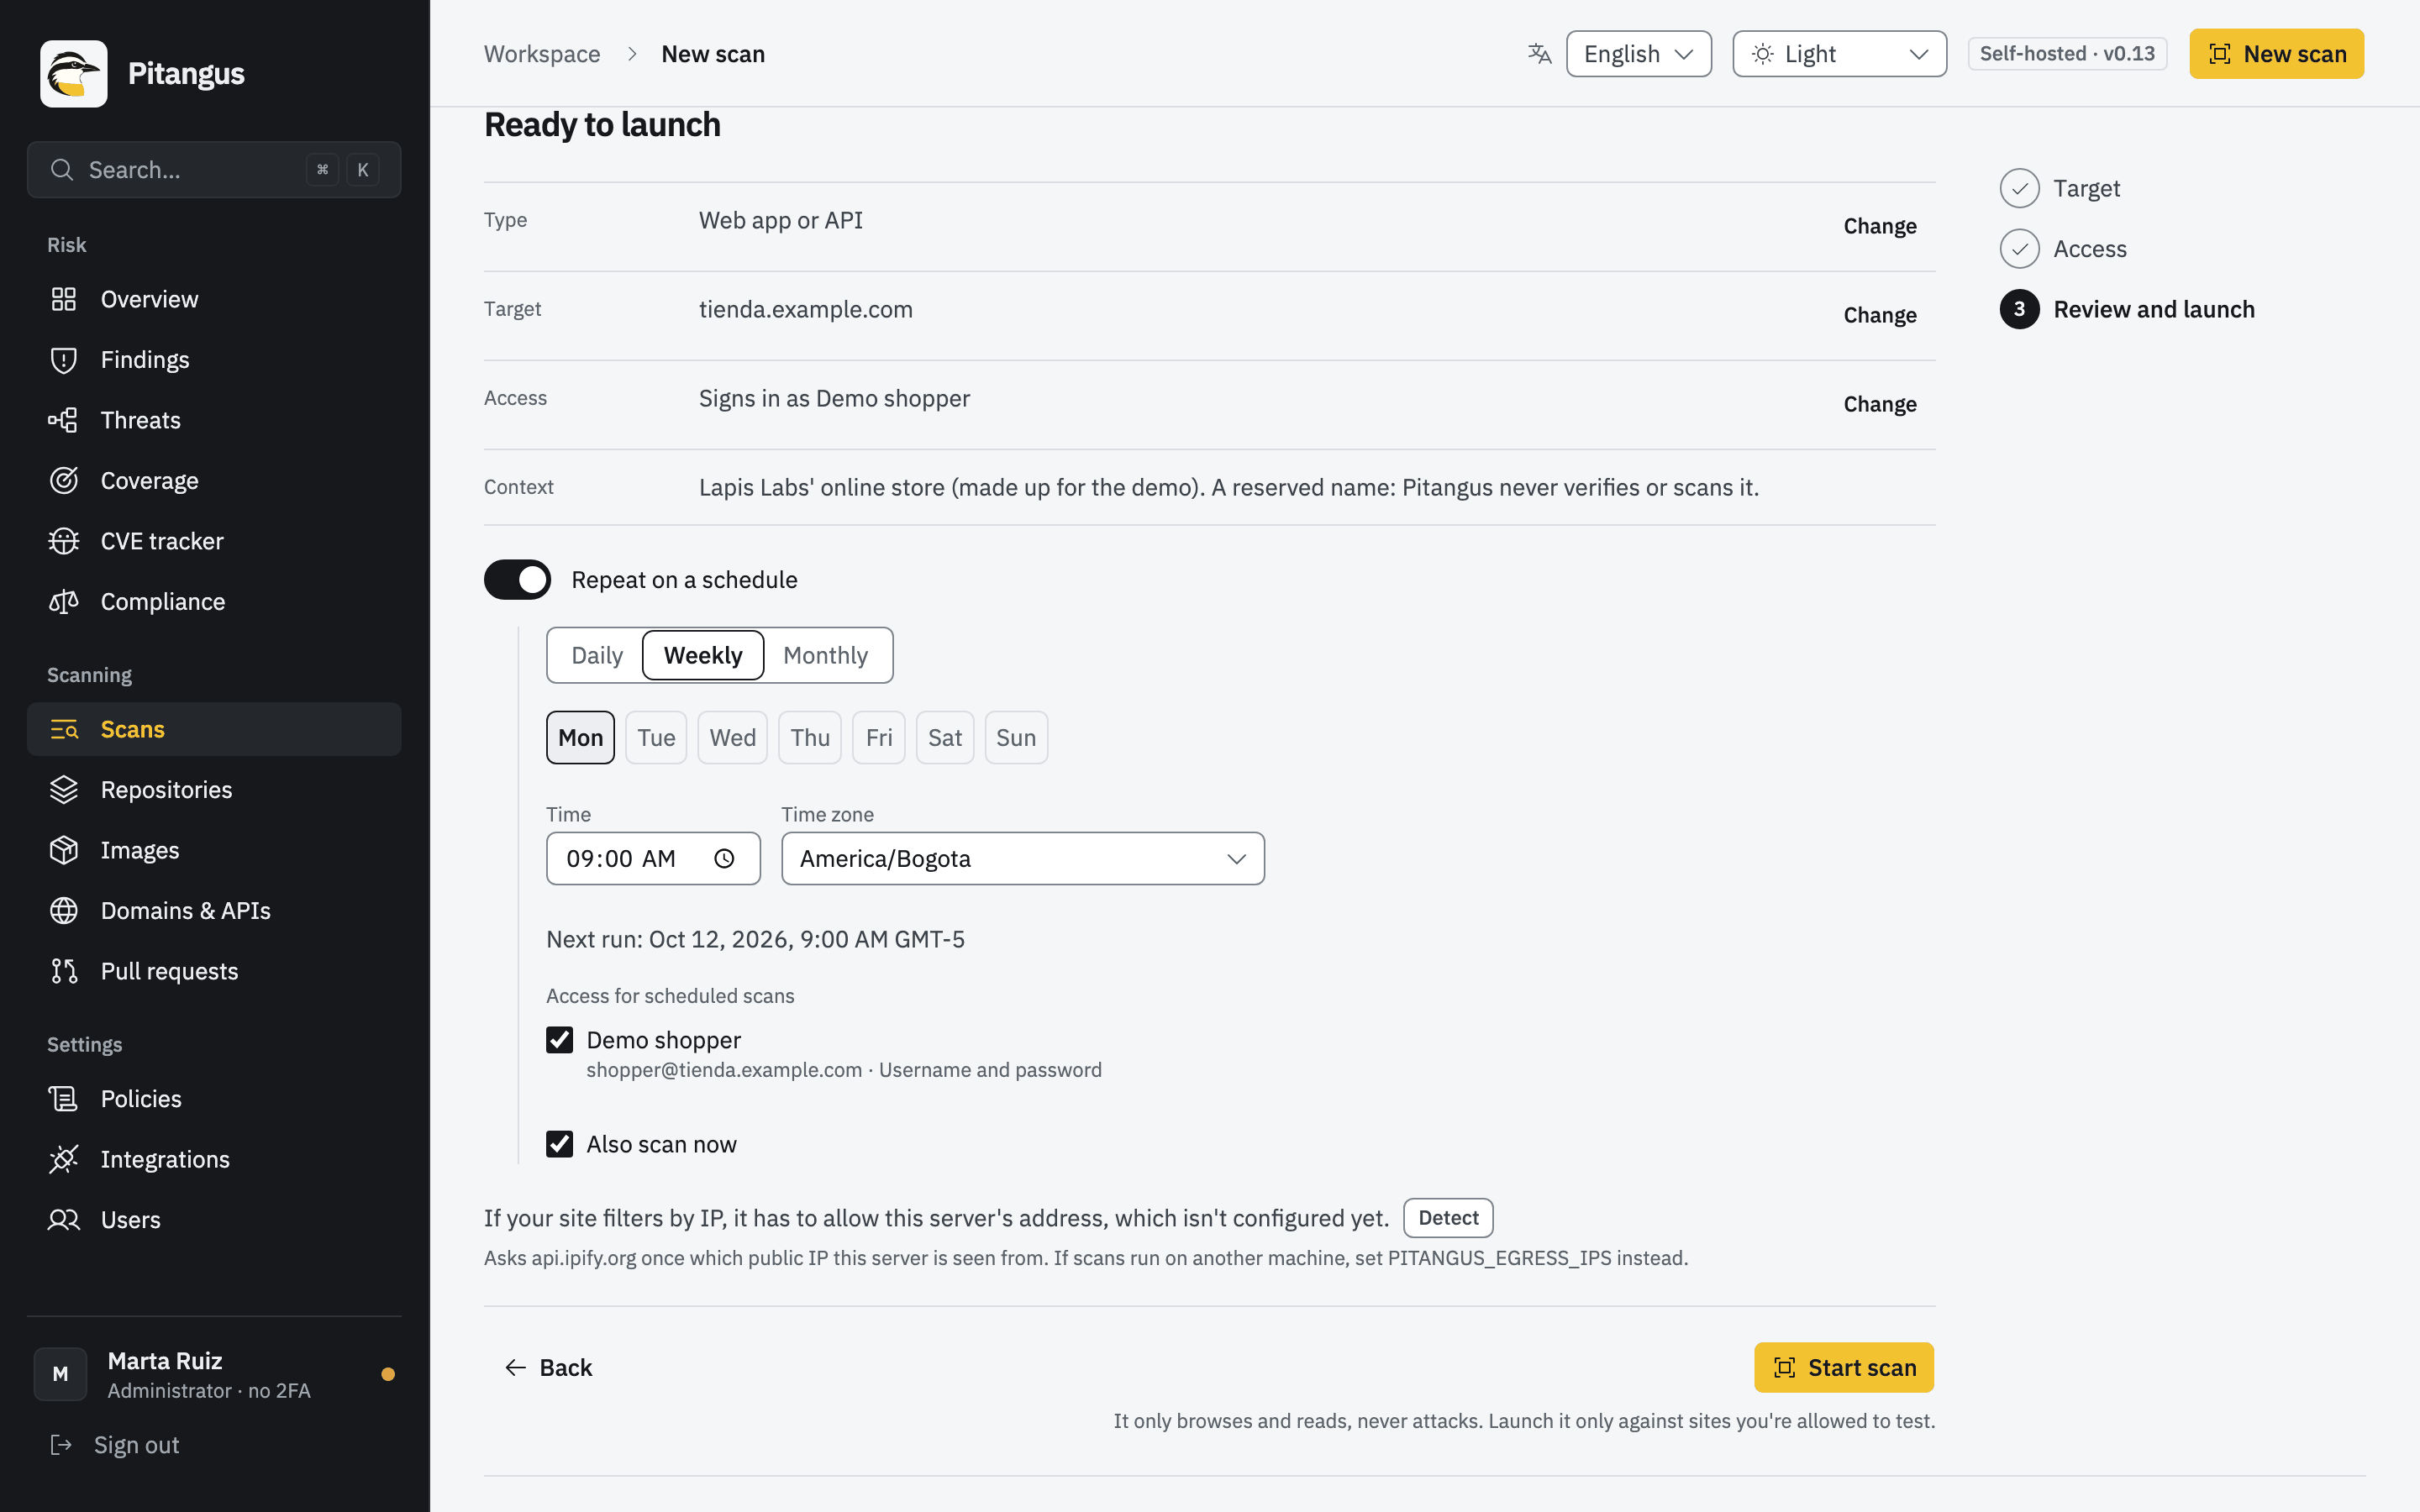
- Review and launch: check the type, target, scope and access; optionally turn on Repeat on a schedule (see Schedule it); copy the outgoing IPs if your site filters by IP. Click Start scan (or Schedule scan).
The scan is queued and its progress shows in Scans (#/analyses). Only one web scan runs at a time per
installation; a second one waits for it to finish.
API mode
Section titled “API mode”An API has few links to follow, so give Pitangus its definition: an OpenAPI 3.x or Swagger 2.0 file (JSON or YAML, up to 5 MB), uploaded with Upload OpenAPI file or as a URL on a host of the scope.
- Only its GET and HEAD operations are requested, at most 2000. POST, PUT, PATCH and DELETE are removed before ZAP sees the definition, so nothing is created, changed or deleted.
- Requests go to the domain’s host (the definition’s own
serversare replaced). - References to other documents (
$refoutside the file) and YAML anchors are refused: bundle the definition first. - A URL is fetched once from the host’s checked address, without redirects.
- The run keeps only the definition’s SHA-256 and its number of operations.
- The definition adds the documented endpoints to the crawl; it doesn’t replace it. With test users, it is imported as each one who signed in.
Scheduled scans browse the site and don’t use the API definition.
What each tool does
Section titled “What each tool does”A scan runs these tools in this order. Each has its own step in the run, with a state (Completed, Partial or Skipped) and the reason.
| Tool | Version | What it does | Hard limit |
|---|---|---|---|
| katana | 1.7 | Crawls the scope’s hosts with a headless browser to find URLs | About 5 minutes |
| robots.txt and sitemaps | Pitangus | Reads each host’s robots.txt and sitemaps for more URLs | 2 minutes for all hosts |
| ZAP | 2.17 | Spider, AJAX spider and passive rules over every response | 15 minutes plus extras (Limits) |
| nuclei | 3.11 | Detection-only templates on each host and on crawled pages | 15 minutes |
| testssl.sh | 3.2 | TLS protocols, ciphers, certificate and HSTS of the first 3 hosts | 5 minutes per host |
| httpx | 1.12 | Names the technologies each host answers with | 2 minutes |
| httpx + OSV | OSV-Scanner 2.6 | Looks up exposed versions of known packages offline | 10 minutes |
Every tool runs in a hardened container that can only reach the scope’s hosts, at their addresses checked just before the scan, at most 10 requests a second.
ZAP: crawl and passive rules
Section titled “ZAP: crawl and passive rules”ZAP crawls the domain for up to 2 minutes (a minute more per extra host), then its AJAX spider opens the site in
a headless Firefox for up to 2 minutes (5 levels, 100 page states). The AJAX spider only clicks links (<a>), never
buttons or form inputs, stays inside the scope and avoids logout links. Both run again as each test user who signed
in.
ZAP’s passive rules then read every response: security headers, cookies, information leaks, personal data (PII),
outdated JavaScript libraries, version-revealing headers, debug errors, suspicious comments and more. They run only on
the scope’s hosts. These rules are set explicitly so an image update can’t switch them off: PII disclosure (10062),
debug error messages (10023), sensitive information in URLs (10024) and in the Referer (10025), suspicious comments
(10027), vulnerable JavaScript libraries (10003), in-page banners (10009), version-revealing Server,
X-Powered-By, X-Backend-Server, X-AspNet-Version and debug headers (10036, 10037, 10039, 10061, 10052, 10056),
private IP addresses (2), session IDs in URLs (3), hash disclosure (10097) and modern web application (10109). The
image’s beta and alpha rule sets aren’t installed.
katana and the URL inventory
Section titled “katana and the URL inventory”katana crawls the scope’s hosts with a headless browser (3 levels, 2 minutes, no forms). Pitangus adds the URLs in each host’s robots.txt and sitemaps (no redirects, size-capped, XML that declares a DOCTYPE or entities is refused), the API definition’s GET paths and what ZAP’s spider reaches. Together they make the run’s URL inventory: in-scope hosts only, without query strings, up to 500 URLs, with how many each source added. ZAP requests up to 200 of them before its spider, and nuclei reads them too.
nuclei: detection templates
Section titled “nuclei: detection templates”nuclei runs the detection-only templates of nuclei-templates 10.4.9 (about 2,400: exposed files, misconfigurations, versions, takeovers, TLS) on each host’s root, and the page-level ones on up to 100 pages of the inventory. Pitangus keeps only templates that send GET or HEAD with no body, no payloads and no fuzzing, with no attack markers in their paths and no attack or login tags. A CVE template is kept only if it reads fixed paths, so it detects a version or an exposed file and never exploits. It runs without updates and without an out-of-band server.
Pitangus adds its own templates (ids pitangus-…), which pass the same filter: an open directory listing and
credentials in a JSON response on every page of the inventory, and on each host a fixed list of 28 sensitive paths
(backup and configuration folders, Spring Boot actuator, metrics, server-status, phpinfo, credential files, .env,
.git/config…), exposed
API descriptions and development metadata files. Each one proves the content, not just a 200. A published
security.txt shows with the domain’s technologies.
A match on a path the site answers exactly like a random path of its own (the same status and the same page: a catch-all
or a “soft 404”) isn’t reported, whichever template matched: it says nothing about that path. The pages are compared by
a simhash of the words in the text (not the tags) of the first 8 KB of each body, with both requested paths taken out of
both bodies first (as sent, decoded, HTML-escaped or without the leading slash), so a catch-all page that repeats the
path it was asked for (/_debugbar/open could not be found) is still the same page. The body is read for this
comparison only and never kept.
nuclei’s own text (description, remediation, references, CWE and CVE) is shown as published.
testssl.sh: TLS
Section titled “testssl.sh: TLS”testssl.sh reads the TLS of the first 3 hosts of the scope: protocols, ciphers, certificate, forward secrecy, HSTS and other headers. Its vulnerability checks don’t run. Only what it rates low or worse becomes a finding. Its certificate checks (chain of trust, revocation, expiry, lifetime, name) are one finding per host with every check as evidence. testssl.sh gives no remediation text, so its findings say only what it reported.
httpx: technologies and exposed versions
Section titled “httpx: technologies and exposed versions”httpx names the technologies each host answers with (frameworks, servers, libraries). They’re shown under Technologies on the domain’s page; a server’s version is a technology there, not a finding.
When httpx reads a version (at least major and minor) of a well-known package, OSV-Scanner looks it up offline in the same OSV databases that dependency scans use: Flask, Django, Werkzeug, Tornado, Gunicorn, aiohttp, Express, Next.js, Nuxt, jQuery, jQuery UI, jQuery Migrate, Bootstrap, AngularJS, Lodash, Moment.js, Underscore, Handlebars, DOMPurify, Vue, React and Axios. Nothing is sent to the site or to the internet for this.
Each product and version with advisories becomes one finding, such as “Flask 2.2.3 has known vulnerabilities” (tool
httpx + OSV), with every CVE, the worst severity, the version that fixes them all, KEV and EPSS. Its confidence is
lower: the version comes from what the site shows, and a backported fix keeps the old number, so confirm it on the
server. A JavaScript library ZAP already reported at that version isn’t repeated. Web servers and runtimes (Apache
httpd, nginx, OpenSSL, PHP, IIS…) aren’t looked up, and the step lists them as not looked up.
Read the results
Section titled “Read the results”Progress and partial coverage
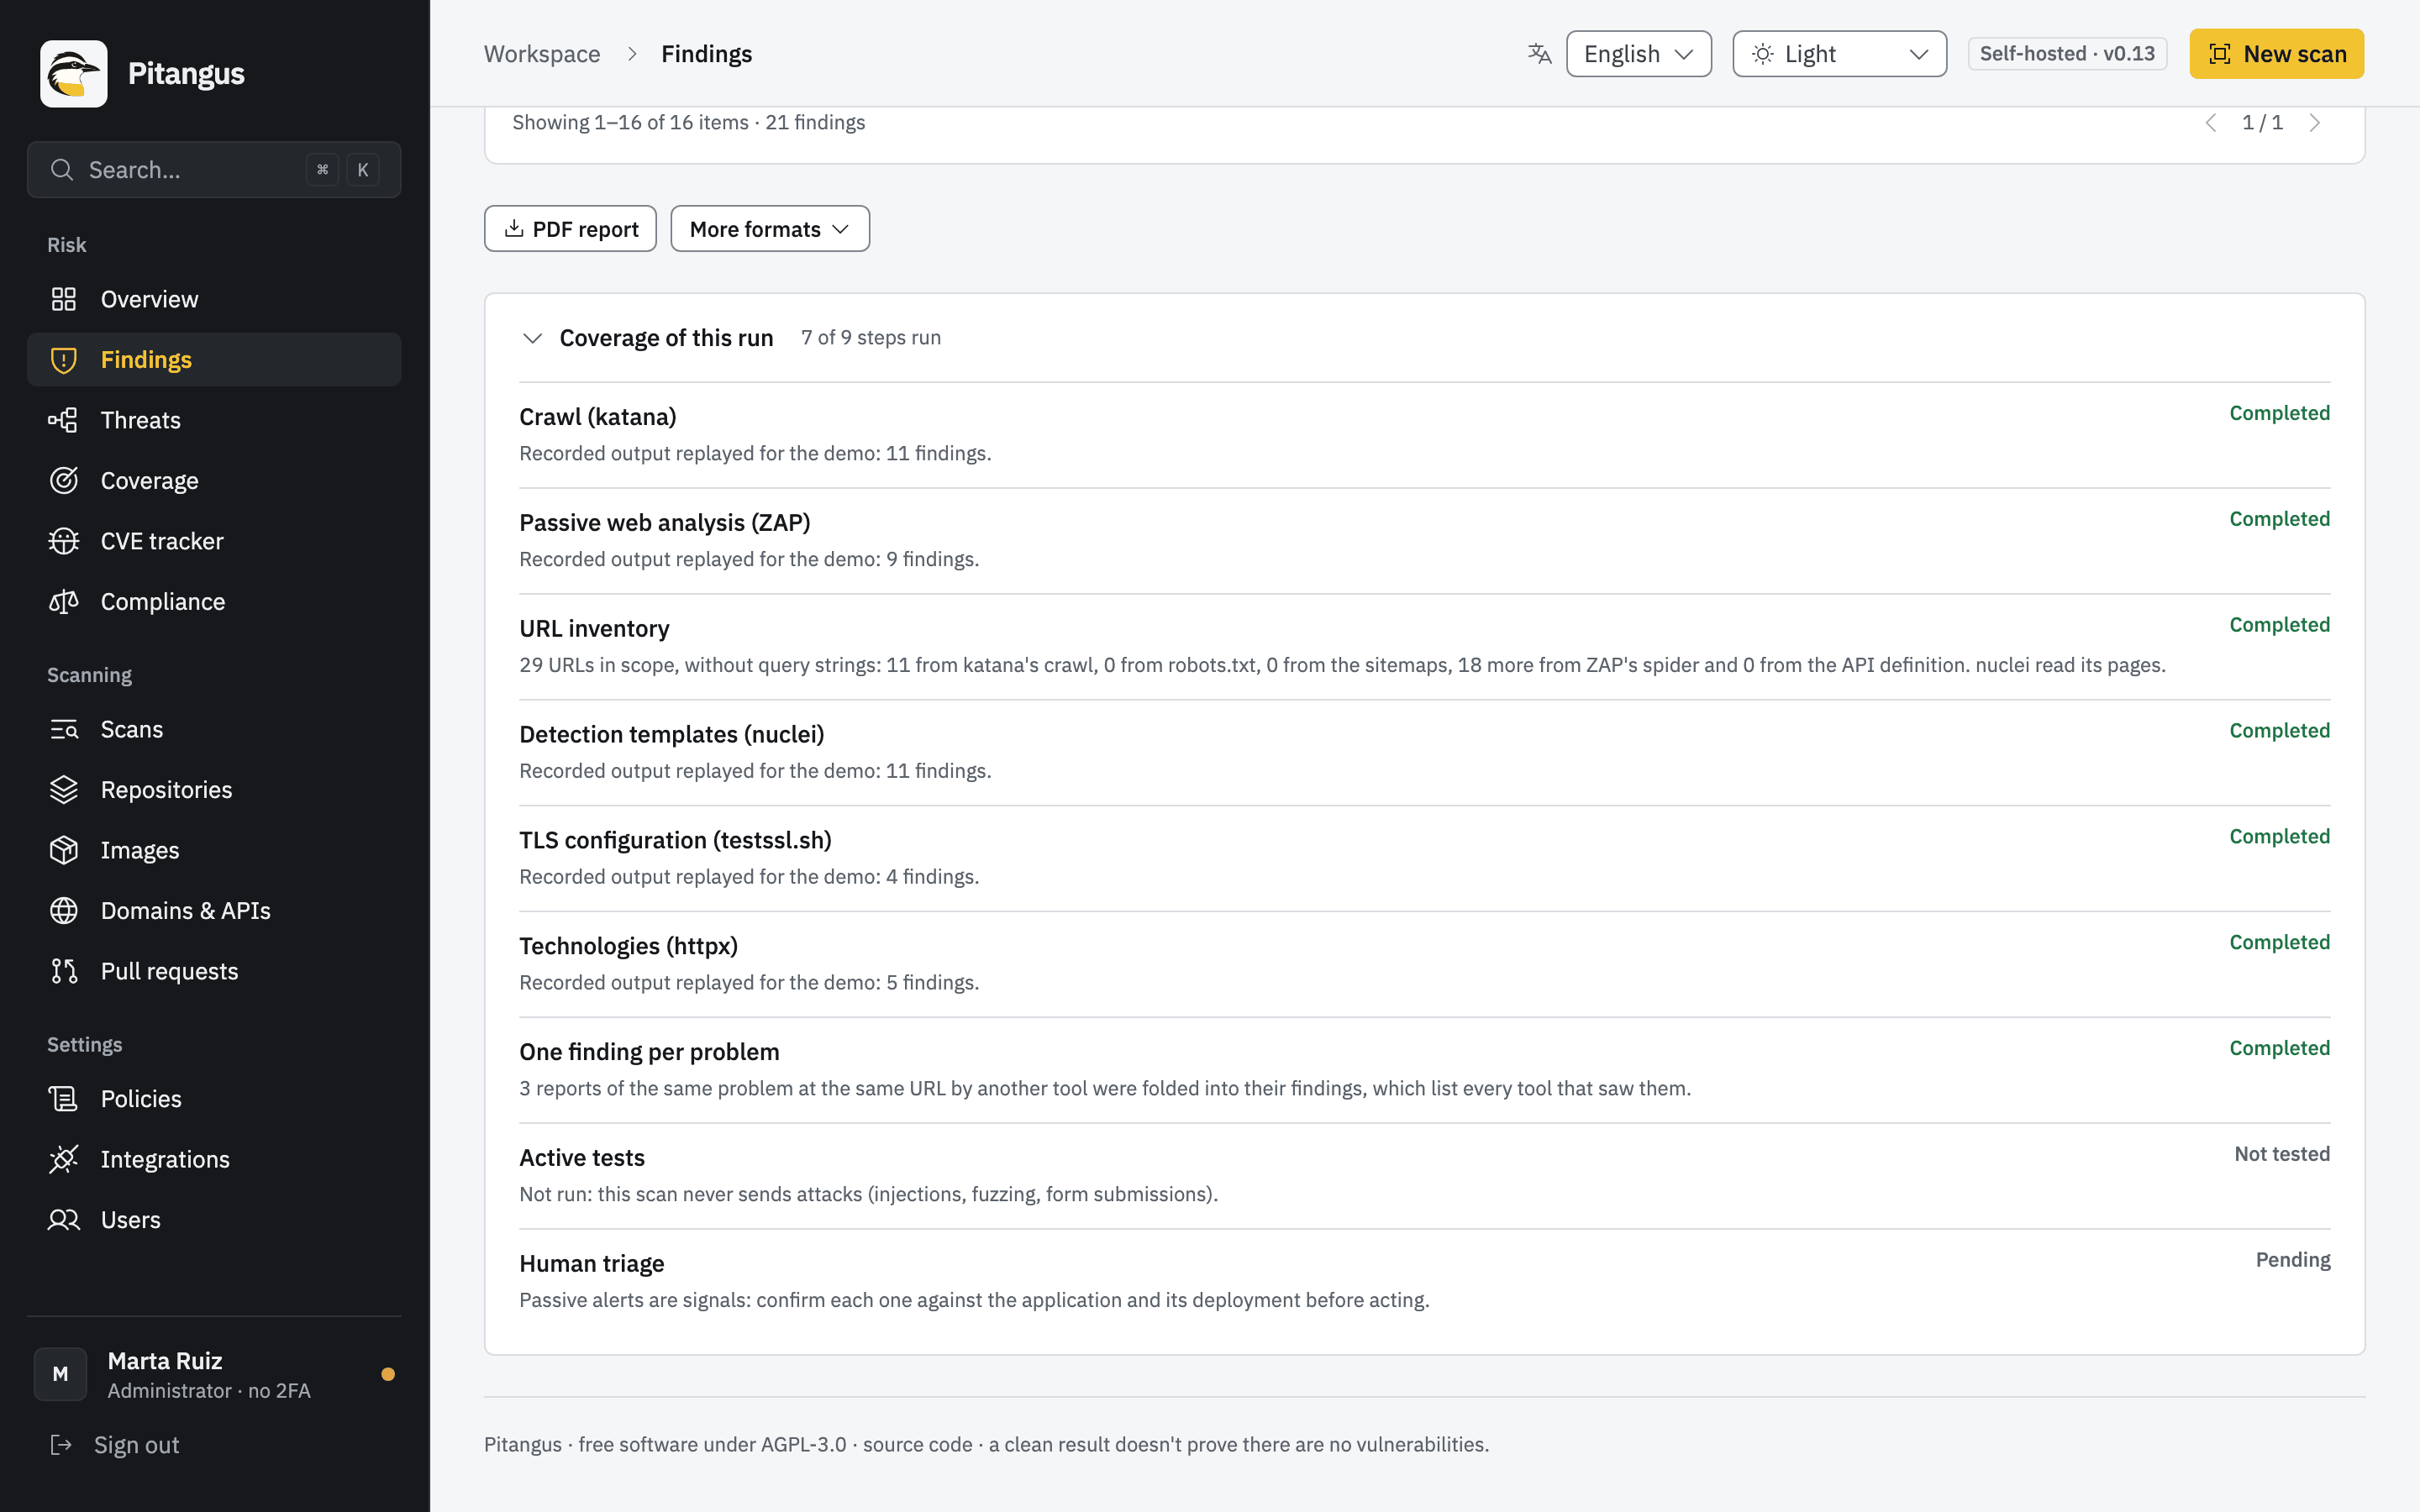
Section titled “Progress and partial coverage”The run shows one step per tool, plus the sign-in check, the URL inventory and the merge of duplicates.
- Completed: the tool did its part.
- Partial: it failed, timed out or didn’t reach a host. The scan goes on; what only that tool had seen isn’t marked fixed, and a tool that didn’t finish (stopped, out of time, an error exit, output cut short) opens nothing either: half a run’s matches aren’t findings.
- Skipped: it didn’t run (image missing, no Docker), with the reason.
Nothing is claimed clean when a tool didn’t reach a host. If nuclei skips a host as unresponsive, katana or httpx get no answer, or testssl.sh can’t connect, the step names the host and says that finding nothing there proves nothing.
Nor when the site turned the scan away. Every answer of every tool over the whole run counts (ZAP, katana, nuclei and httpx): if at least 80% of a host’s answers are refusals (any status that isn’t a 2xx, a 404, a 410 or a redirect: 401, 403, 406, 418, 429, a 5xx, a 400, a code nobody defined, no status at all), to the run as a whole or to any one tool (a WAF that only woke up during nuclei’s phase), or at least 1 in 20 is a 429 (a rate limit), the steps name the host and the run is Incomplete, so it marks nothing fixed. Allow the addresses scans leave from (listed in the new analysis wizard) and scan again.
One finding per problem
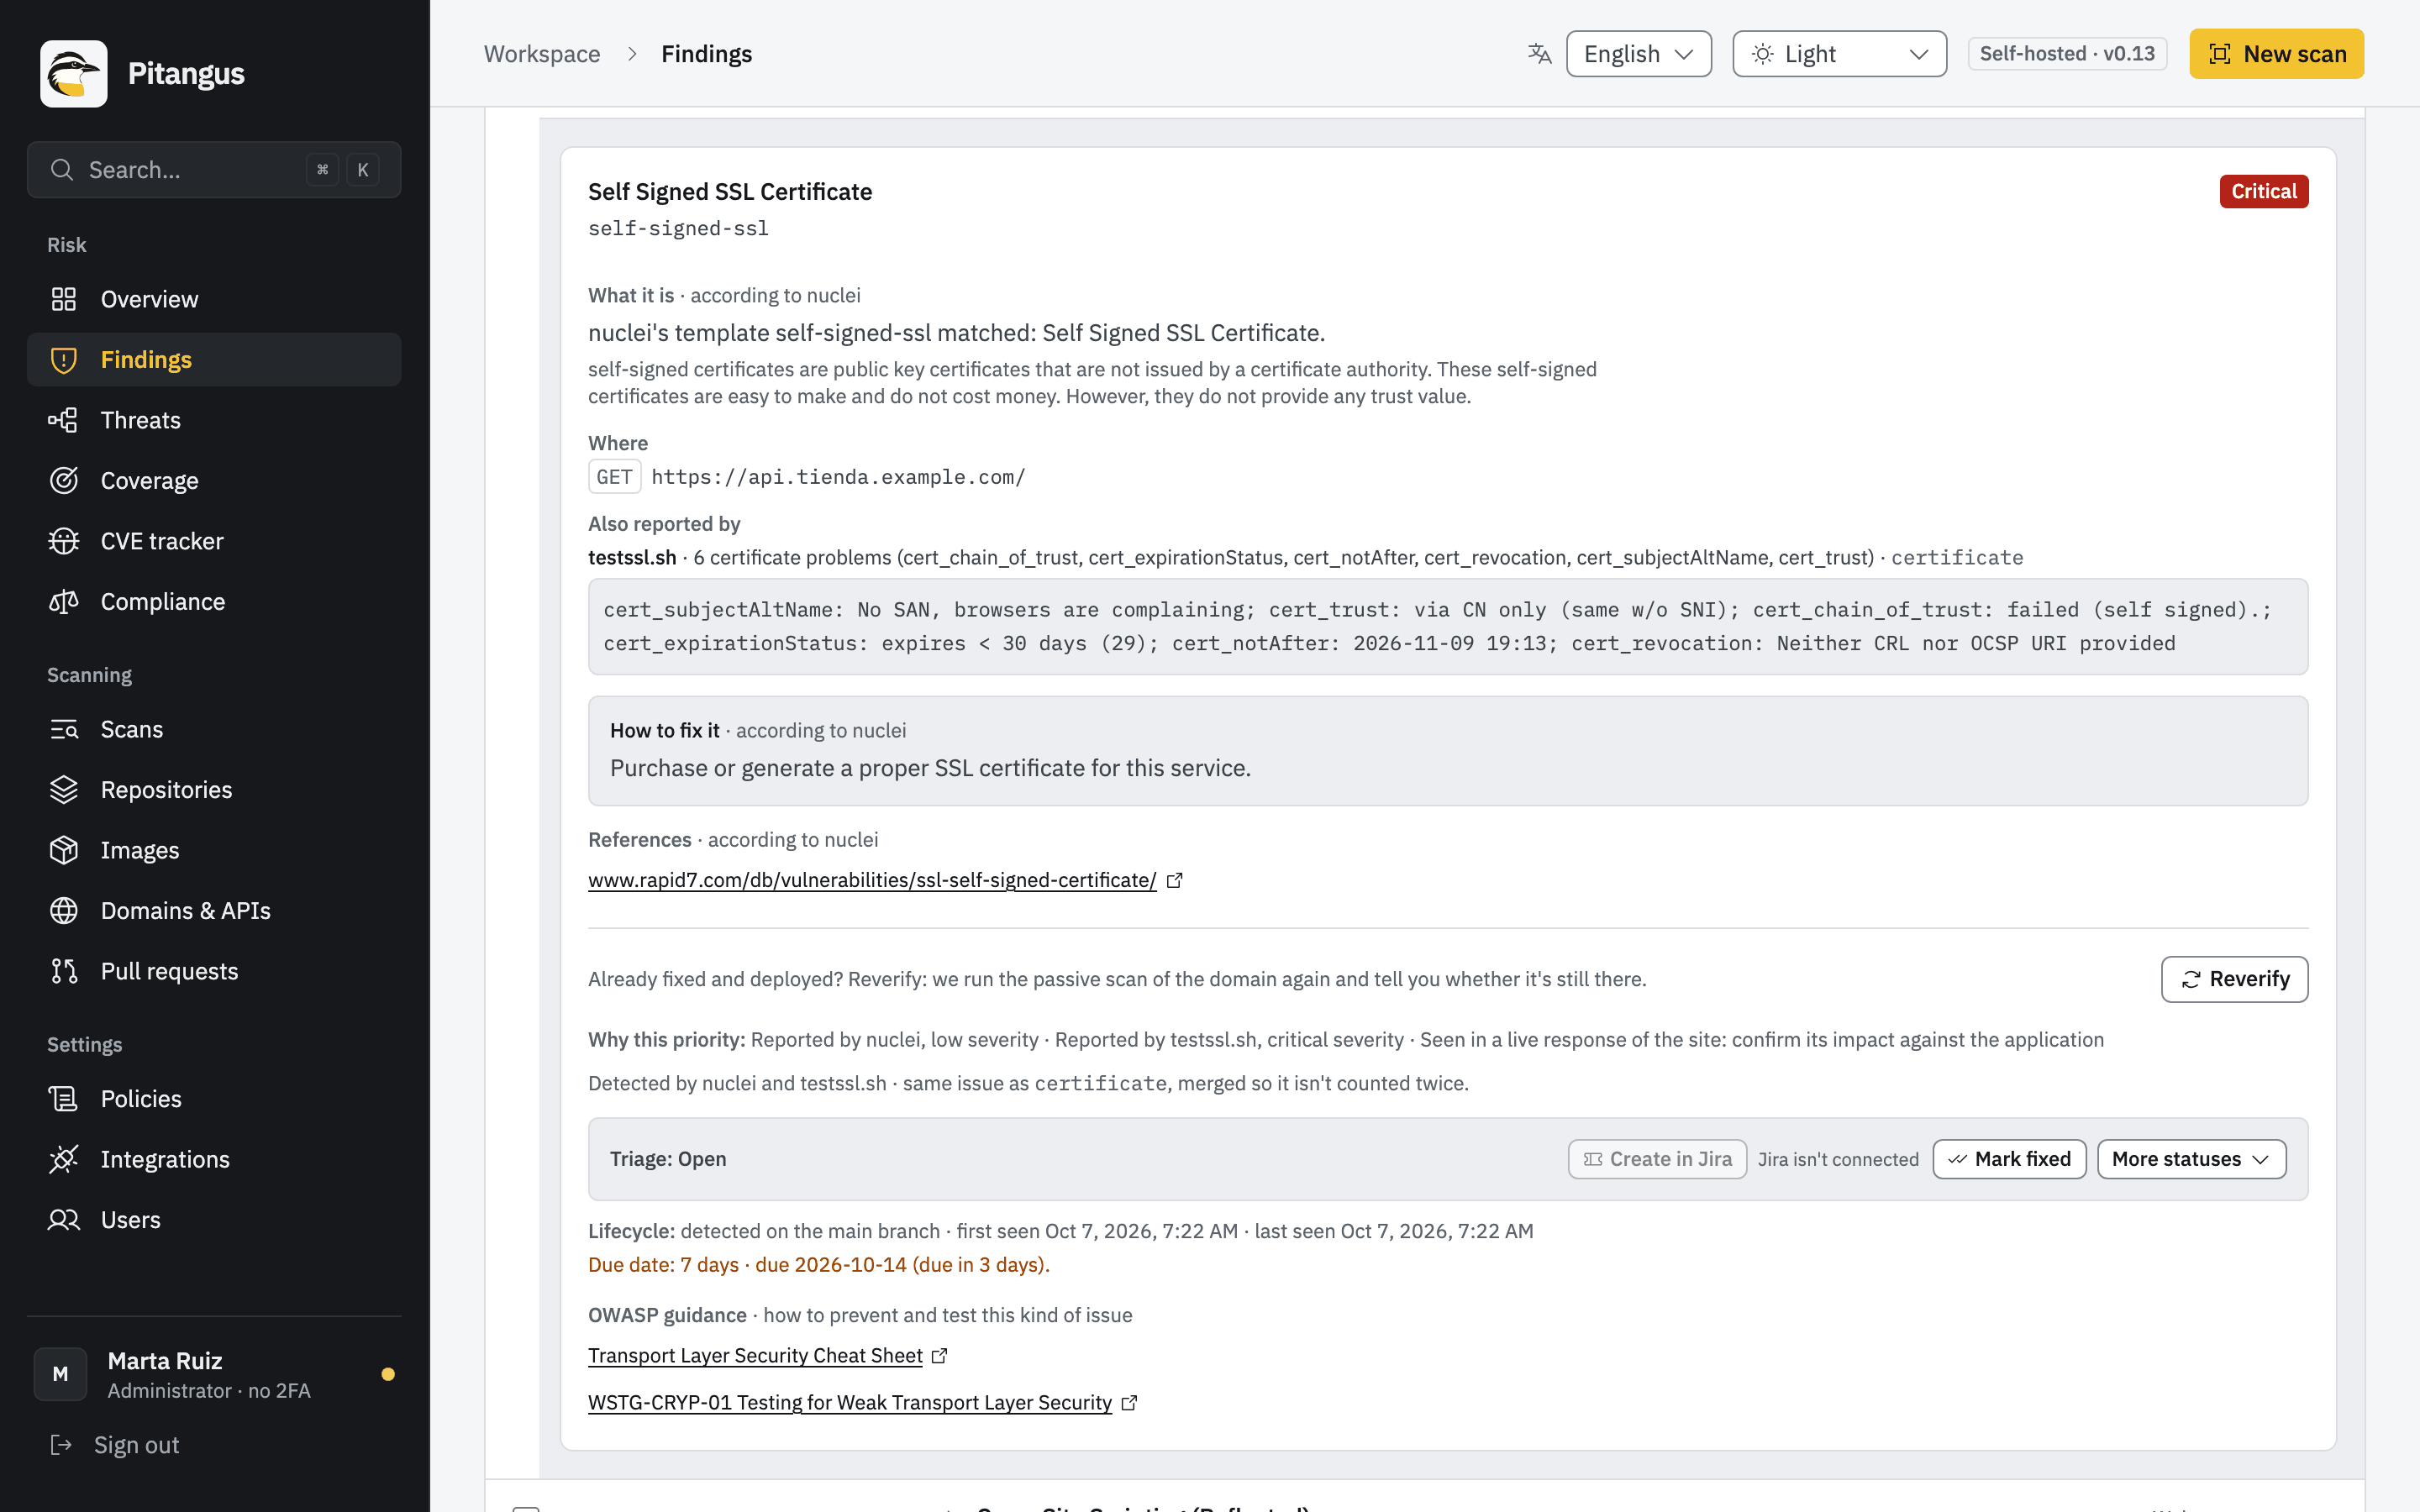
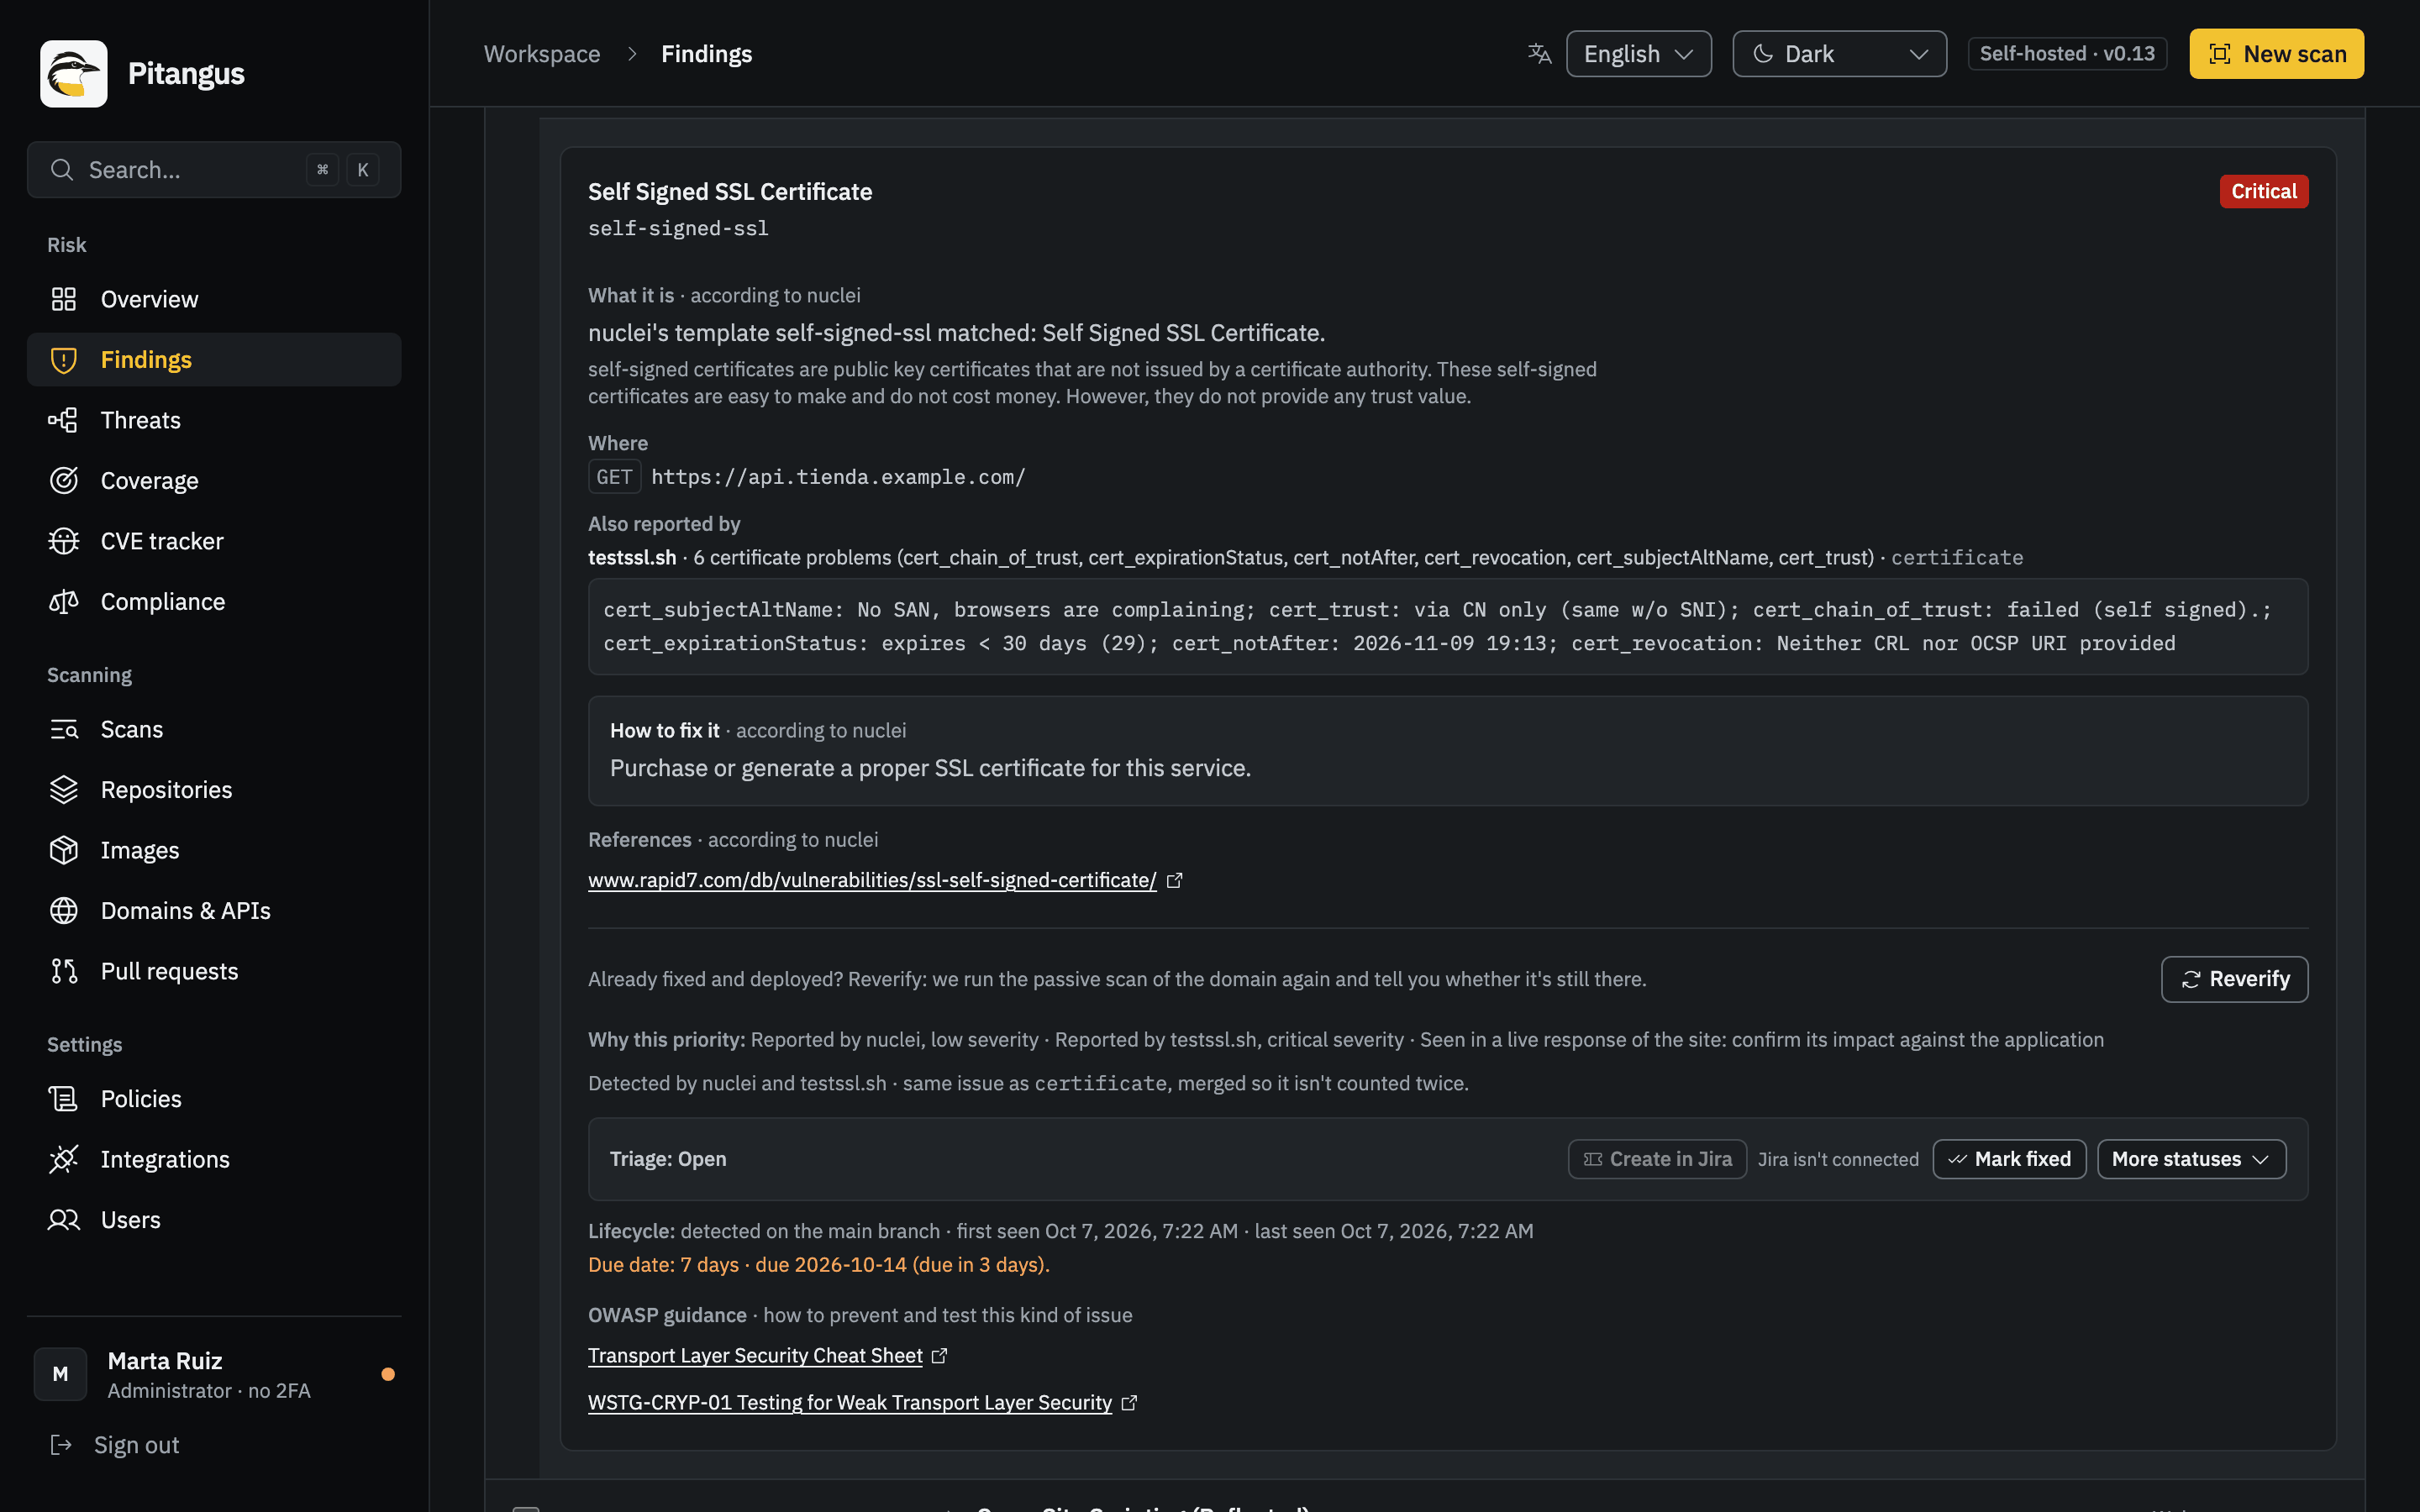
Section titled “One finding per problem”When ZAP, nuclei or testssl.sh report the same problem at the same URL, Pitangus keeps one finding that lists every
tool that saw it and what each one saw (Also reported by in the detail). Only explicit equivalences count: missing
security headers, cookie flags, HSTS, deprecated TLS and weak ciphers, certificate problems, an exposed .git or
.env. Nothing is merged by title or CWE alone.
In Findings and in the technical report, the same problem on several URLs is one row that opens to each URL, for example “15 findings in 8 problems”. Every URL keeps its own triage and history, and the figures count them one by one. Two exceptions keep one change from becoming dozens of findings:
- A response header the whole site shares (CSP missing or misconfigured, HSTS, X-Frame-Options, X-Content-Type-Options,
Permissions-Policy, a
ServerorX-Powered-Bythat names its version, and nuclei’s missing security headers) is one finding per host, at its root, however many pages ZAP or nuclei reported it on. So is the same evidence on many pages for what usually comes from the shared template or the server: one suspicious comment, oneCache-Controlvalue, one cacheability verdict (a different comment or value is another finding). - Findings stored per page before this grouping fold into the host’s finding on the next scan instead of being marked fixed.
- A file name with a build hash (
/_astro/index.CSY8UEx1.js,/assets/app-BkL9x2a1.css) keeps its finding across deploys: the hash changes, the finding and its triage stay. The detail still shows the real URL.
Redirects (3xx) aren’t part of the URL inventory: the page they point to is. Each finding’s detail shows the tool’s guidance first, then OWASP guidance. See findings.md.
When a web finding is marked fixed
Section titled “When a web finding is marked fixed”The next web scan marks fixed what no longer appears, but only among what a scan like it had seen: same mode, same API definition, same use of headers and of test users, on a host it actually looked at, and only with evidence from the tool that reported it, on that page, in this run: for a ZAP finding, a 2xx ZAP itself got for the page (its sites tree); for a nuclei finding, nuclei’s own answers for the page (its stored responses and request log), every one of them on the whitelist below and none a request without an answer; for testssl.sh, a host it finished.
Only a status that proves something about the URL counts, and a finding about one path (an exposed .env, a console,
a backup: anything nuclei found off the root) is only proven gone by an answer that says the path is gone:
| Status | What it proves | A finding about one path | A finding about the root | Blocking check |
|---|---|---|---|---|
| 2xx | the URL serves something | not fixed (the path still answers) | fixed if no longer reported | doesn’t count |
| 404, 410 | the URL serves nothing | fixed | fixed | doesn’t count |
| 3xx | nothing about the URL | not fixed | not fixed | doesn’t count |
| anything else (400, 401, 403, 405, 406, 418, 429, 5xx, 999, none) | nothing: a refusal | not fixed | not fixed | counts |
A redirect proves nothing either way: it isn’t the file, and it isn’t its absence. It doesn’t count toward the blocking check, because sites send plain HTTP to HTTPS and unknown paths to their login all the time. A 200 doesn’t prove a file gone even when the template stopped matching: a WAF’s JavaScript challenge, a catch-all page and another file all answer 200, and only a 404 or a 410 tells them apart from a file that left. Another tool’s answer never vouches: a 404 httpx saw doesn’t prove gone what nuclei found while it was being rate limited. An anonymous crawl doesn’t vouch for what was found while signed in; a crawl doesn’t vouch for an API definition’s endpoints; no scan vouches for a host it didn’t reach or for a tool that ended partial.
Web findings use the same fingerprints as an import of ZAP’s SARIF, so importing your own ZAP run of the same site doesn’t duplicate anything. Only the method, the parameter and a short, redacted piece of evidence are kept, never the full request or response. Re-verifying a web finding launches a new web scan (administrators only).
Schedule it
Section titled “Schedule it”An administrator can repeat a passive scan per domain: from the review step (Repeat on a schedule, with Also scan now) or from the domain’s page.
| Setting | Options |
|---|---|
| How often | Daily, Weekly (choose days of the week) or Monthly (days 1–28) |
| Time and Time zone | A time of day in an IANA time zone, your browser’s by default |
| Access | Up to 3 test users and the saved headers |
The page describes the rule in words (“Every Monday at 09:00 (America/Bogota)”) and shows the next run. Pitangus looks for due scans every 5 minutes and runs a domain at most once a day: if it was already scanned that local day, the schedule moves on to its next run. Scheduled scans cover the domain’s host and its saved scope, one at a time.
What is left out when a scheduled scan runs:
- A test user deleted since is removed from the schedule.
- A test user who now signs in outside the saved scope is left out of that run.
- Headers no longer saved aren’t sent.
- The API definition isn’t used.
- A domain whose proof lapsed is skipped with the reason (Paused) until it’s verified again.
The run and the domain’s page say what was left out.
Sites that filter by IP
Section titled “Sites that filter by IP”If a firewall or WAF in front of your site only lets known addresses in, allow the address Pitangus scans from. The review step shows it under If your site filters by IP, allow: with a Copy button.
- Set it with
PITANGUS_EGRESS_IPS(IP addresses or CIDR ranges, comma-separated, at most 16; see configuration.md). - Without it, an administrator can click Detect once: the server asks
https://api.ipify.orgwhich address it’s seen from and keeps the answer (see security.md). That is the API’s address: if the worker runs on another machine, set the variable to the worker’s address instead. - Members without an address see a note to ask an administrator.
Disconnect a domain
Section titled “Disconnect a domain”Disconnect domain, at the bottom of the domain’s Overview, deletes its configuration: saved headers, test users (with their passwords and TOTP keys), related hosts and saved scope, and its scheduled scan. Deleted credentials can’t be recovered.
What was scanned or imported against it (runs, findings, triage, tickets) stays in Scans and Findings as evidence, and links back if you add the same host again.
Limits and timings
Section titled “Limits and timings”| What | Limit |
|---|---|
| Web scans at once | 1 per installation |
| ZAP | 15 minutes, plus 1 per extra host, 3 per test user’s crawl, 3 per AJAX spider (the anonymous one and one per test user) and 2 seconds per inventory URL it requests; container with 3 GB and 2 CPUs. Sign-in checks: about 2.5 minutes per test user, before the scan |
| katana / nuclei / testssl.sh / httpx / exposed versions | about 5 / 15 / 5 per host (3 hosts) / 2 / 10 minutes |
| Requests per second (katana, nuclei, httpx) | 10 |
| Domains per workspace | 20 |
| Hosts in scope besides the domain | 20 (100 listed) |
| Headers / test users per domain | 10 / 10 |
| Test users per scan | 3 |
| API definition | 5 MB, 2000 GET and HEAD operations |
| URL inventory | 500 URLs |
Most scans take 15 to 25 minutes.
What the evidence rules can’t tell apart:
- A challenge page served with 200 (a WAF’s JavaScript or captcha check) looks like any other page. It never fixes a finding about one path (only a 404 or a 410 does), but it isn’t counted as a refusal either: a single-page site answers every path with one page too, and that isn’t a block. A challenge served on every path of a host, the root included, can still stand in for the root’s headers in a finding about the root.
- A site that answers 200 for a path it removed (a single-page app’s shell, a catch-all page) leaves the finding open and Unverified: remove the path so it answers 404 or 410, or close the finding by hand.
Known limitations in 0.14, measured during the release validation:
- An exposure that comes and goes (a file served only some of the time) is dropped when the check’s own requests don’t agree.
- A single connection error from testssl.sh or nuclei on a host leaves that host incomplete: conservative, it fixes nothing there, but one flaky connection is enough.
nginx-eol(and other “what the server runs” findings) is one finding per page in the full web scan instead of one per host.- The blocking thresholds (80% refusals, 429s on 5% of a host’s answers) were calibrated on local test sites, not yet on real CDNs and WAFs.
API reference
Section titled “API reference”Every route takes and returns JSON. Reads are open to any signed-in user; every write needs an administrator.
| Route | Does |
|---|---|
GET /api/domains |
Lists domains with proof, schedule, last scan, technologies, dast and egress |
POST /api/domains |
Adds a domain (url, kind, context) |
POST /api/domains/probe |
Checks a URL before adding it (/api/domains/check is an alias) |
POST /api/domains/verify |
Asks for the proof once (method: dns, file or meta) |
GET /api/domains/scope / POST /api/domains/scope |
Reads or saves the scope (set, add, remove, exclude_all); 409 without a DNS proof |
POST /api/domains/discover |
Searches for related hosts again (202) |
POST /api/domains/headers |
Saves or removes a header |
POST /api/domains/test-users |
Saves or removes a test user |
POST /api/domains/scans |
Queues a scan (mode, use_scope or hosts, use_headers, test_users, spec or spec_url); 202 with run_id |
POST /api/domains/schedule |
Sets or removes the schedule (frequency, weekdays, month_days, time, timezone, test_users, use_headers) |
POST /api/domains/egress |
Detects the outgoing address once |
POST /api/domains/remove |
Disconnects a domain (answers runs_kept) |
Common errors
Section titled “Common errors”| What you see | Why | Fix |
|---|---|---|
| Not enabled on this server, or “The full web scan is turned off” | The full web scan is off | An administrator turns it on in Settings → Analysis engines. If the message names PITANGUS_DAST_ENABLED, the server pins it off: set it to 1 for the API and the worker and restart (make up). |
| “The ZAP image isn’t on this server: run make engines” (or another tool) | The image wasn’t pulled | Run make engines. A step marked Skipped says which. |
| “Web scans need the Docker runner” | The worker has no Docker socket | Use the Docker runner (containers.md). |
| No TXT record found yet | Wrong name or value, or DNS hasn’t propagated | Check with dig +short TXT _pitangus.<host>, wait a few minutes, verify again. |
| The file or tag “answered with a redirect” | The proof is served through a redirect | Serve it from that exact host, no redirect. |
| The domain resolves to a private or reserved address | The name points to an internal IP | Only public sites are scanned. Use the public name. |
<host> has no current DNS proof |
Subdomains need a DNS proof | Verify with the TXT record. |
| Couldn’t sign in as «name» | Wrong credentials, a login page the browser can’t complete, a check page that doesn’t answer 200 | Read the reason, fix the test user (login and check URLs, TOTP key) and scan again. The run has partial coverage meanwhile. |
| A tool step is Partial or Skipped | The tool failed, timed out, couldn’t reach a host or its image is missing | Read the step’s reason. What only it had seen isn’t marked fixed. |
| Steps can’t reach hosts, few URLs, many 403s | A WAF or firewall blocks the scanner | Allow the outgoing IPs from the review step (Sites that filter by IP). |
| “A web scan is already queued or running” | Only one web scan runs at a time | Wait for it to finish. |
More in troubleshooting.md.
Next steps
Section titled “Next steps”- findings.md: triage, deadlines and the lifecycle of what a scan finds.
- integrations.md: import the SARIF of your own ZAP, nuclei or Strix runs against a verified domain.
- security.md: what leaves your server and how the scan containers are isolated.
- troubleshooting.md: when something doesn’t work.
- glossary.md: the terms used on this page.